Status display in the tree view
You now have added your server computer(s) to the list of things to monitor. Let’s have a look at what information is available.
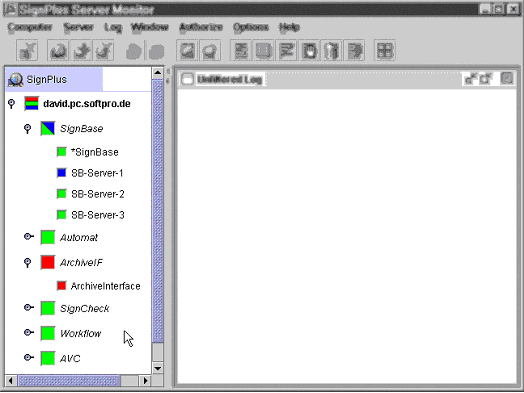
The left part of your Server Monitor is the ‘tree view’. It displays an overview of the status information regarding the server processes running on the monitored computers. It is built on three levels:
1.Computers: this is the topmost level and displays all computers you have added to the list of things to monitor. You can add and remove computers with the functions in the Computer menu.
2.Groups: server processes can be grouped together. The SignBase group will, for instance, contain all servers related to the SignBase functionality. This gives you an overview of the status of a functional group.
3.Servers: the lowest level contains the actual server processes.

The status of a server is displayed using the following colors:
Color |
Status |
Description |
|---|---|---|
Green |
Running |
The component is running (normal operational status). Depending on work available a different shade of green is used. A server actually processing items is displayed in light green, while a server waiting for work is displayed dark green. This differentiation only applies to servers supporting the ‘waiting for work’ status. |
Blue |
Stopped |
The server process has been stopped by an administrator, or has not been started yet. |
Red |
Error |
The server process has an error and it is not running. |
Gray |
No connection |
There is no connection to this server process. The monitor can’t retrieve information about it, yet it might be running normally. |
The group and computer icons display the status of the elements below it. If, for instance, one server of a group is running, while another is stopped, the group icon will display two colored sections, one green, and the other one blue. This gives you an overview of the global status, without the need to expand all levels.
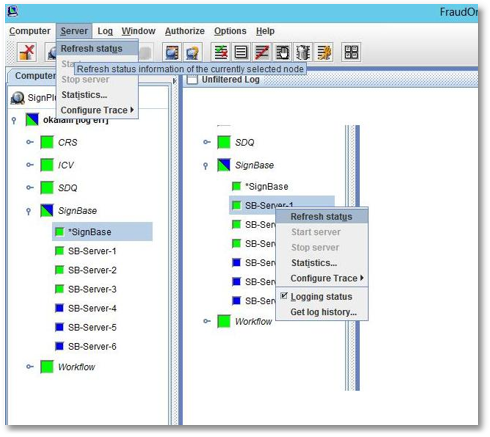
The status information will be periodically refreshed. If you want to force a refresh at a given moment of time, you can use the
Computer > Refresh status
or
Server > Refresh status
menu, the Refresh status button, or the Refresh status popup menu obtained by right clicking on an item.

