Server statistics display
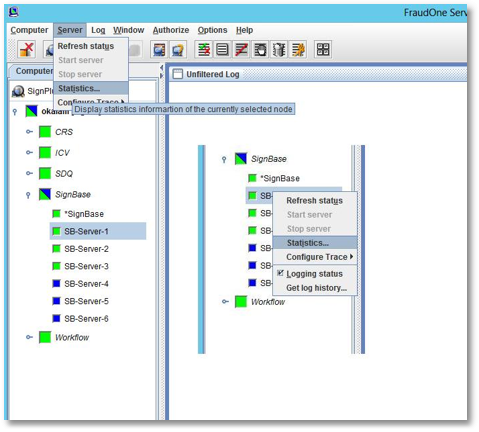
If you need more detailed information on a specific server process, you can use the statistics view. Select the server process you’re interested in and call Server > Statistics from the menu. Alternatively, you can click the Statistics button, or right click on the server and call Statistics from the popup menu:

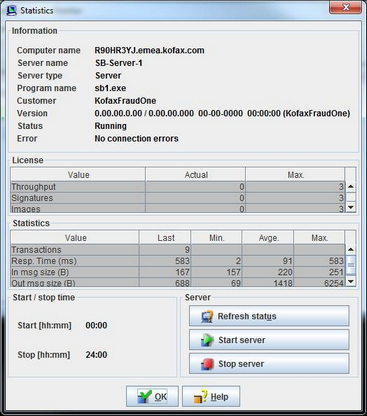
The Statistics dialog will display essential information about the server process selected:
•Basic information:
Computer name, server name, process name, customer, status, errors, …
•License information:
SignCheck throughput, number of signatures and account images.
•Statistics information:
Statistics information depending on the nature of the server (messages processed per second, kilobytes per second …)
•Start configuration:
The start configuration from the server manager. If you have specified a starting and stopping time for this server (the server manager will start and/or stop the process at the given time) it will be displayed here. You can’t change this value here, you must edit the server manager configuration file to do so.
You can refresh the information displayed using the Refresh status button. You can also start or stop the process with the appropriate buttons, but authorization information is necessary to do so.
Click the OK button when you’re finished viewing the information.

