Create filters
Use filters to manage the data displayed in a component. You can apply a filter to multiple charts at once, or apply multiple filters to a single chart. For example, you can have a chart that displays total sales by month, and then filter it by the Region dimension using one filter and by Country using another, where the Country filter changes depending on the Region filter.
The relation between filter components and filtered components is defined via Filter Groups and Incoming and Outgoing Actions. A project can have several Filter Groups and some can be designed to be used only in the current View; such groups are marked "local." Filters from local groups influence only components from a particular View. Other filters, not marked "local," influence all components globally.
For the filter to be associated with a chart, the Outgoing Actions of a filter need to point to a certain Filter Group and the Incoming Actions of a component (chart) need to be defined for the same group.
Also, you can apply a filter that affects only a selected series associated with a particular chart. To do this, set the required Filter Group in the Data wizard for a particular series, but do not select it in the Incoming actions in the Actions wizard.
You can also use the following time filters.
-
Time window: Use the calendar controls to define any time interval.
-
Period driver: Select one of the preset intervals: current day, last 7 days, Year-To-Date (YTD), Month-To-Date (MTD), Quarter-To-Date (QTD), or any other custom interval defined in the filter data wizard.
-
Time filter: Select a standard interval. It can be either a day, month, quarter, or year.
Also, you can use other advanced filters:
-
Entity driver: Change the source metric or record for the component in the Viewer.
-
Parameter filter: Change the value for the parameter used in the derived fields or a record or metric. In this case, the data is dynamically updated according to the selection.
-
Aggregation driver: Change the aggregation for the data series based on auto metrics.
Create a View
In this example, you will add filters to the main project View. Do the following:
-
Copy the Menu View, name it
Main, and drag a period filter component to the canvas.

-
Predefined time intervals use current data as the
To date, but the sample
Adventure Works database contains data only for the years 2012-2014. So you
need to remove all the selections for the preset time intervals. Add several
intervals
To last available date of
metric and one editable custom interval.
- Click Add new data.
- Type 1Y to last date in the Name column, click the ellipsis icon in the Edit column, and select Interval of 1 Years and To last available date of metric. Click the ellipsis icon and select Order Count from the Order Pool Stored metric. Click OK twice in succession.
- Repeat the steps above and add intervals of 1 quarter to last available date of metric (1Q to last date) and 1 month to last available date of metric (1M to last date).
-
Add one more custom interval of 10 days to the last
available date of metric, name it
Custom interval and set it as the default. For this
interval, select
Use time window. In
this case, when the user selects this interval in the Viewer, the calendar
opens with this interval set by default. However, the user will be able to
adjust the dates as required.
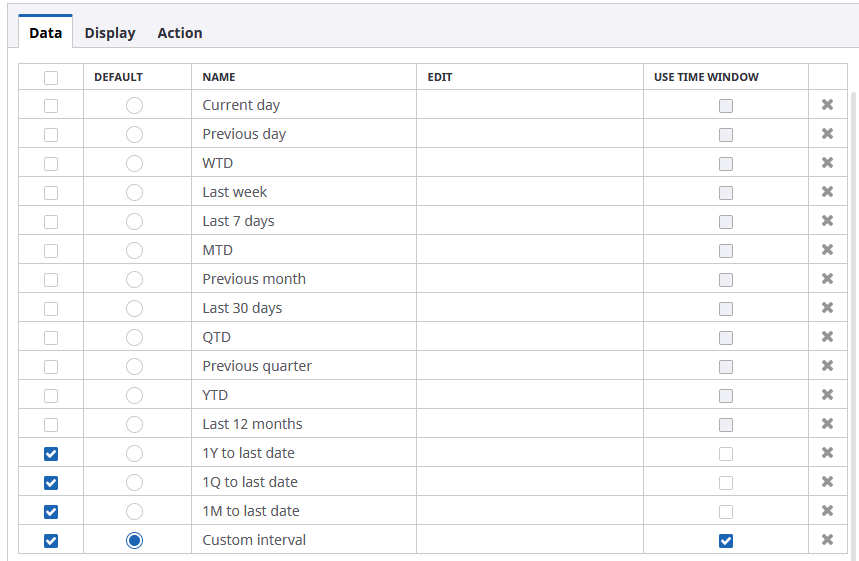
- Click OK.
-
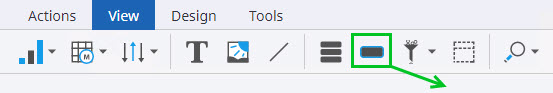
Add a dimension filter to the View. Drag a filter to the
canvas.

-
Configure the wizard. On the
Data tab, click the
ellipsis icon for the dimension and select
Order Pool
> Order Count> CountryRegionCode. Click
OK.

A filter may be set up based on the record field, translation table field, or metric dimension. All values from the field or metric are shown in the drop-down list of the filter and can be set as filter values in the Filter Group. -
For user convenience, we also recommend adding a button to the
View to reset filters. Drag a button to the canvas.
-
Configure the Action wizard: select
Reset filters as an
action and
All for the
Group. Click
OK.

- Change the text on the button: in the Property Panel find Text and type Reset filters.
-
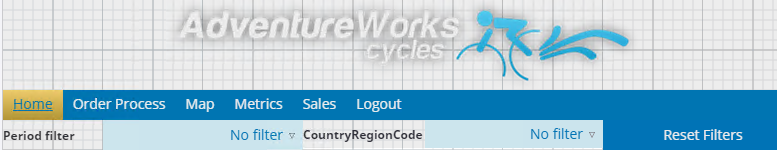
Create a more pleasant look and feel for the View: resize the
filters, place the components as shown in the sample screen below, and create
automatic anchors.
-
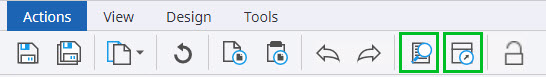
Save the View and open it in the Preview/Viewer.
In Insight, there is a predefined "Current View" Filter Group. By default, all newly created filter components have this group in Outgoing Actions, while the components (grids and charts) have this group in the Incoming Actions. For this reason, you do not need any additional configurations in this example.
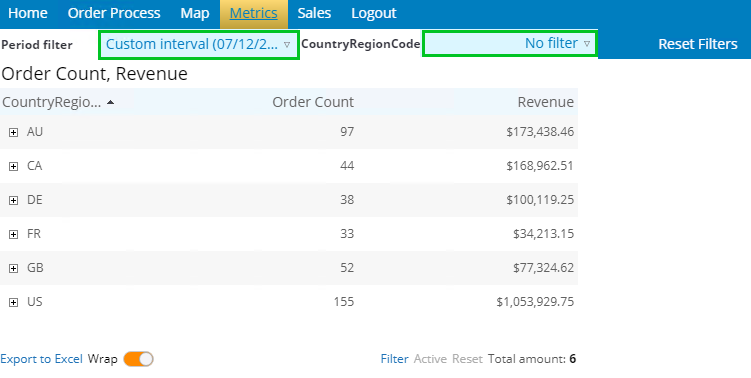
Use filters in the Preview/Viewer
This section describes how the filters behave in the Viewer. By default, the period driver is set to the interval of 10 days to the last available date of metric, which is July 12, 2104 - July 22, 2014.
- Open the Main View in the Preview/Viewer.
-
The
Order Overview View is opened by default in the View holder.
Click the
Home menu button to
launch the
Orders Overview with a dialog box View.
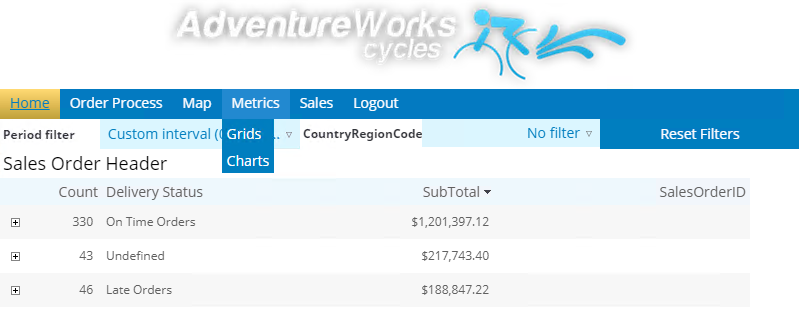
Now, if you open the menu item, and set the filter to US, you can see that the data is changed and shows only US for the period of July 12, 2014 - July 21, 2014.
-
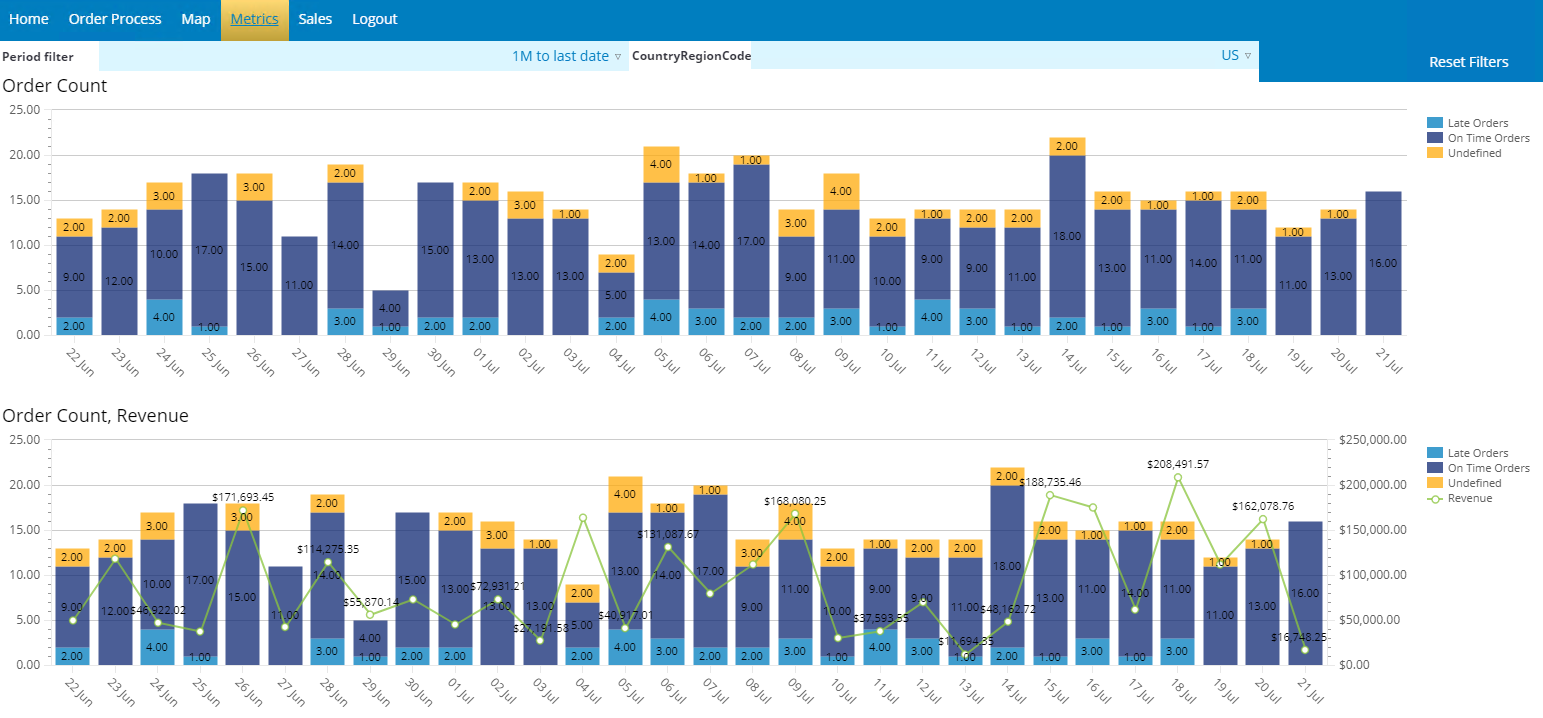
Now change the time in the period driver. For example, select
1M to last date in the
filter. Now the charts show the data only for the last month of June 22, 2014 -
July 21, 2014.
-
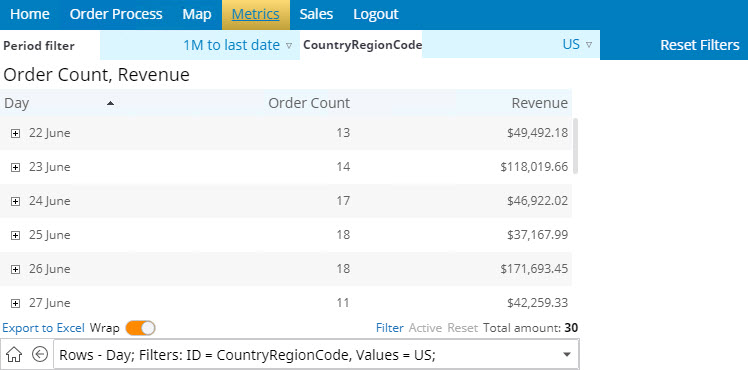
You can also verify that now the data is shown only for the last
month of metric data and only for US. Open
,
click the plus sign in the line and drill down the data: the grid now shows
data broken down by days. To return one level up, click the Back icon in the
grid footer.
-
If you click
Reset filters, all
filters are reset to default: July 12, 2014 - July 21, 2014 for the period
driver and No filter for countries. All the data will be refreshed to the new
filter values.