Create a map component
You can use the Geo Location feature to present your data on a map based on geographic regions, such as countries, states, or counties. The map gives a visual representation of the quantitative data according to the selected filters or dimensions.
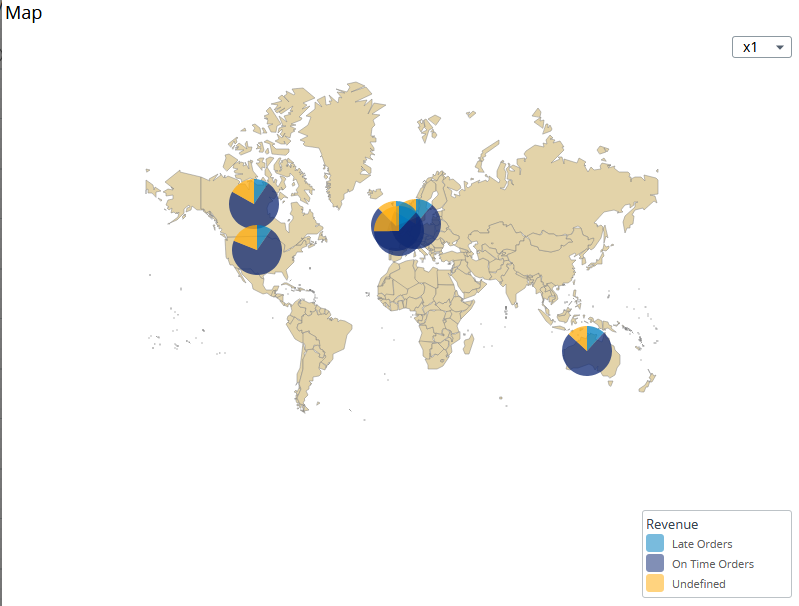
A map component may consist of several layers superimposed on one another and providing different information. For the purpose of this exercise, you will add a pin layer to the map: it will show the small charts with the distribution of late and on-time orders.
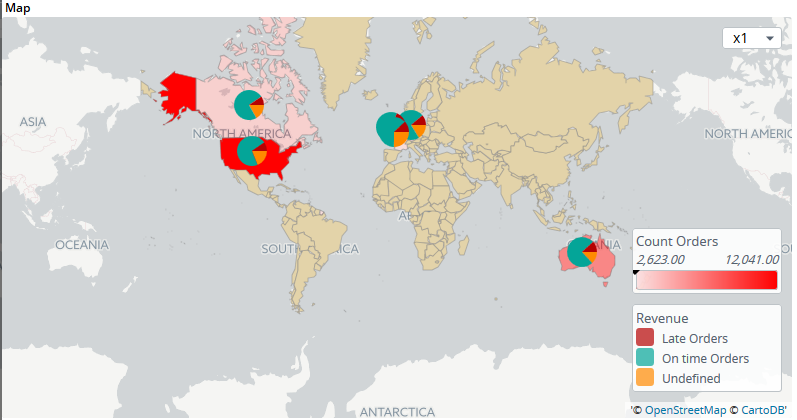
In this exercise, you will prepare data for the map component and geo analysis and create a map that uses variations in the red color intensity to show the number of orders placed in the Adventure Works, while the pins show the correlation between late and on-time orders for the specified locations.
As a pre-condition, geo data must be preloaded into the project. If you are working in the Sample project, the data is already loaded, but if you started a blank project, you need to import the geo data. See the Kofax Insight Studio Help for more information.
To create a map component, do the following.
Create a translation table
First, provide geographical coordinates where the pins will be located. In Insight, the pin layer can consist of pins or even charts placed at the specified locations. For this exercise, you need to create a translation table where the points (pins) on the map are linked with their geographical coordinates.
The coordinates can be added manually (as shown below) or dynamically from the prepared source (an Excel file for example).
- In Studio, on the Documents Tree, right-click Translation Tables and select New Translation Table. Name the translation table Country, select Static, and click OK.
-
Add two new fields: latitude and longitude.
-
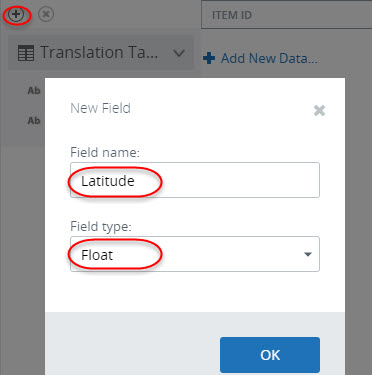
Click the plus sign, name the field
Latitude, select
Float as the field
type, and click
OK.
- Add another field, name it Longitude, and also select Float.
-
Click the plus sign, name the field
Latitude, select
Float as the field
type, and click
OK.
-
In Adventure Works, each order has the Country dimension with
the following values: AU, CA, DE, and such like. To link these values with
coordinates, fill the table below as shown in the screen shot. To add a new
line, click
Add New Data.

-
Save
 the translation table.
Prepare the metric
To link the Country dimension that is present in the metric with the Translation Table (to use the coordinates), follow the procedure below.
- On the Documents Tree, find the previously created Order Pool standard metric, copy it, and change the name to Order Pool Geo. Click OK.
-
Link the translation table with the dimension. Originally, the
metric is created on a record, and the metric dimensions inherit properties of
the record fields. As an option, you could bind the translation table with the
record field and the relation with the metric could be created automatically.
However, it is also possible to make all the modifications only in the metric.
To do this, highlight the CountryRegionCode dimension and assign it to the
translation table.
- In the Property Panel, find Inherited, and remove the selection. Now the metric does not inherit record settings.
-
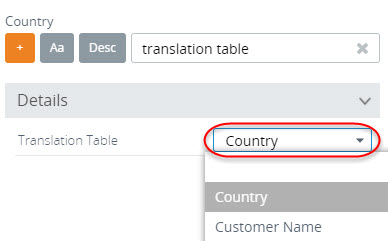
In the
Property Panel, find
Translation Table,
click the space to the right of the text label, and select
Country.
-
Save
the metric.
Create a map component on the View
Now, all the source documents are prepared and you can start creating a map.
- Create a new View and name it Map. Click OK.
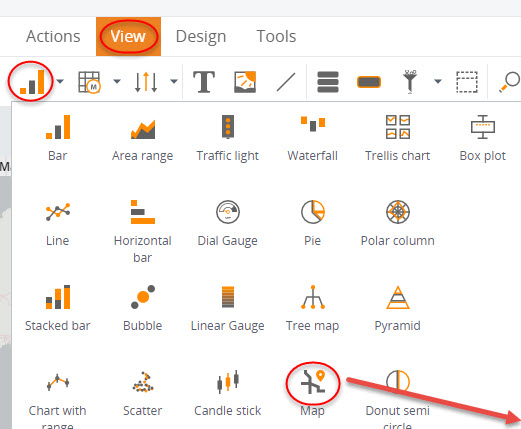
-
Drag a map component to the canvas.
-
Configure the wizard to add pins to the map.
- On the Data wizard, click Pin layers. Click Add New Data, select Chart layer, and click OK. The chart layer wizard appears.
-
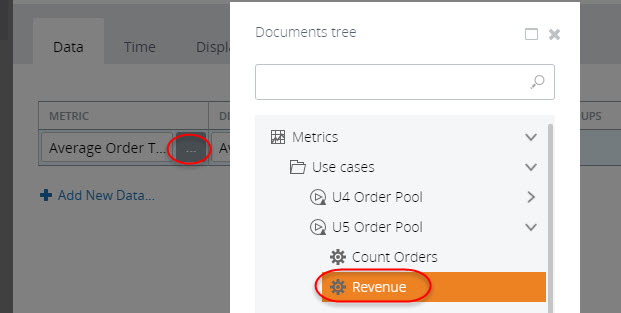
In the
Metric column,
click the ellipsis icon and change the metric to
Order Pool Geo.
Click
OK.
- On the Time tab, select Fixed time window from 1/1/1900 12:00 AM to 1/1/3000 12:00 AM.
- On the Display tab, under Drill Downs, set the following: Location = CountryRegionCode, Breakdown = Delivery Status.
-
Click
Presentation and
change the pin height and width to 50. Click
OK and then
OK again to close
the wizards. Open the component in the Preview/Viewer.
-
To add coloring for countries based on the quantity of orders,
do the following.
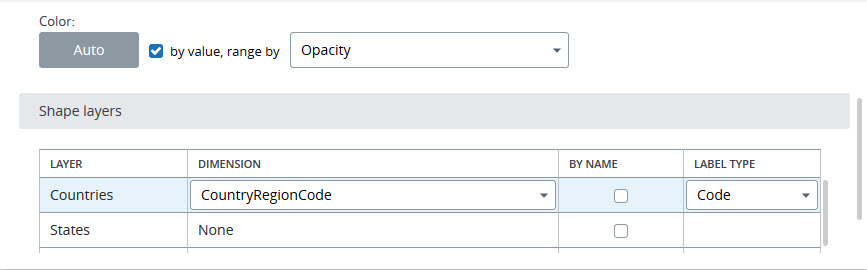
- Open the Data wizard. On the Shape definition tab, click the ellipsis icon and change the metric to Order Pool Geo and Count Orders Value. Then select by value, range by and Opacity.
-
For the Countries layer, set
CountryRegionCode
as Dimension.
- On the Time tab, select Fixed time window from 1/1/1900 12:00 AM to 1/1/3000 12:00 AM.
- Click OK.
-
Save
the View, and open it in
the Preview/Viewer.
If you perform this exercise in a new project rather than in the
Sample project, verify that values for the Country dimension from the source
data coincide with the Insight geo data. To check the geo data, on the
Documents Tree, click
Geo Data, and then select
Specify data.
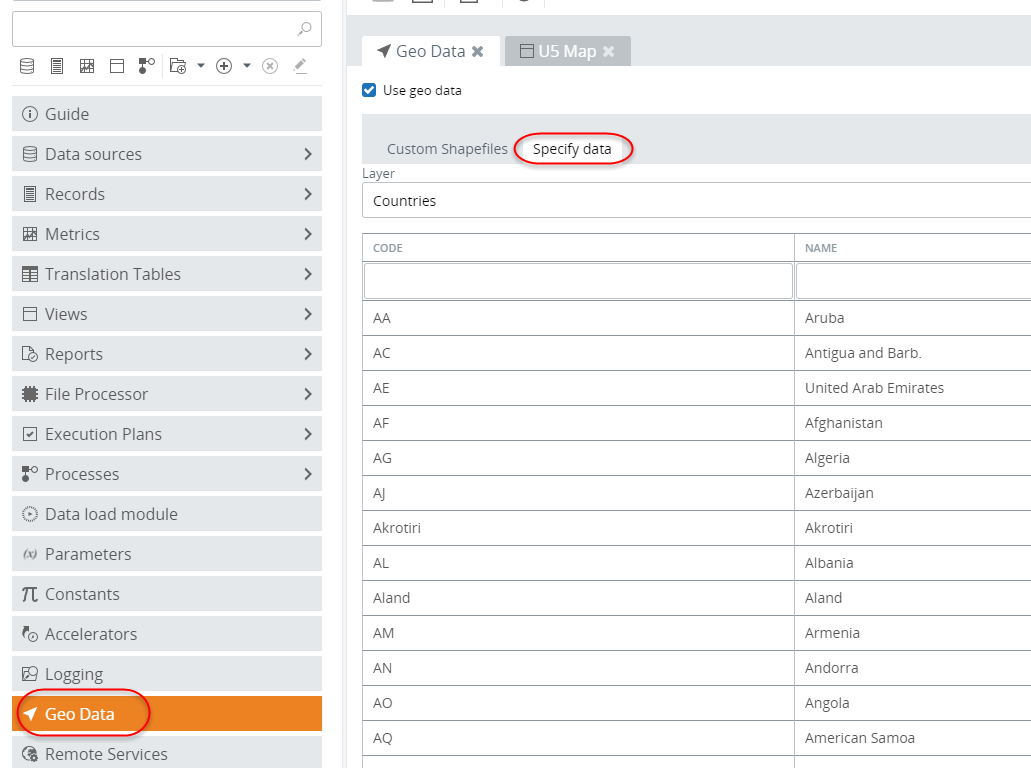
For example, Germany in Insight is coded as GM, while Adventure Works has DE as the code for Germany. For this reason, we have changed the code manually.
- Find the country by
name.
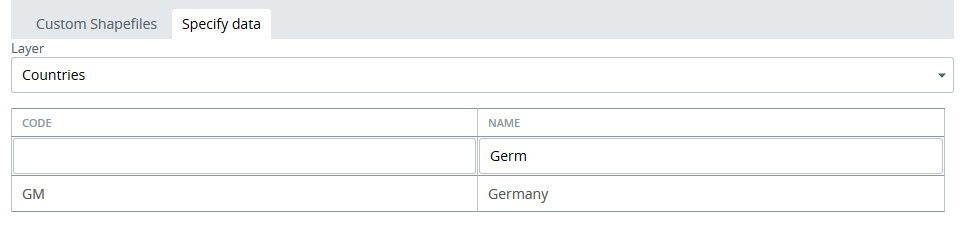
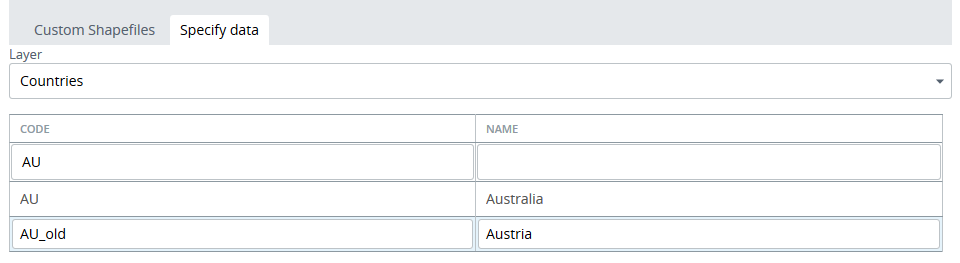
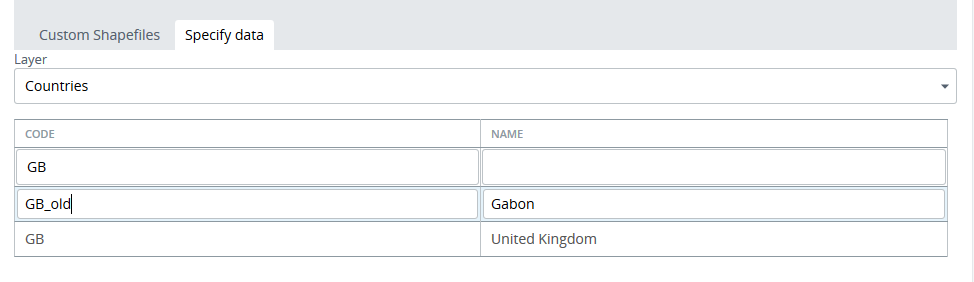
- Click the cell with the country code and change it: Germany to DE, Australia to AU, United Kingdom to GB.
- Now AU corresponds to
two countries: Austria and Australia. Change the code for Austria to
AU_old.
- Change the code for
Gabon to GB_old.
- Save
the changes.