Your search for {searchVal} returned {total} results.
The search returns topics that contain every term you enter. If you type more than one term, an "and" is assumed. The results appear in order of relevance, based on how many search terms occur per topic.
If a search returns too many topics, add more search terms or search for an exact phrase. To search for an exact phrase, enclose it in double quotation marks (for example, “batch class”).
If a search returns too few topics, reduce the number of terms entered or use a partial term. If an exact match cannot be found, the search uses “fuzzy” matching to find similar terms. Only terms with exact matches are highlighted in the search results.
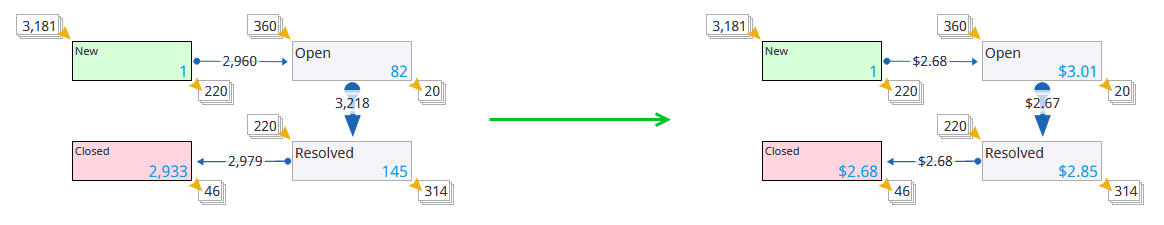
By default, a process chart displays a number of instances inside the
step boxes, on the transition arrows and outside the step boxes (see
Process chart). With
Insight, you can
bind the process chart with some metric and show metric values directly on the
chart instead of the instances count. For example, you can use the metric that
calculates the average age of the patients within the steps and within
transitions.
In
Studio, on the View
area, create a
process chart.
In the
Property Panel, under
the
Other > Metric,
click the ellipsis button and navigate to the required metric. The metric must
be bound with the process. See
Bind a metric or record with the process.
In the
Property Panel,
navigate to the
Display metric values
property and select the check box.
The process chart displays metric values filtered by all process
instances that are currently queued in the steps (the value is shown in the
lower right corner of the step box) or have already passed the transitions
between the steps (the value is shown on the transition arrow).
To switch between these two modes of showing values in the Viewer,
right-click the process chart, navigate to
Process config, and
select or clear the
Display metric values
check box.
Figure 1. Process chart with instances (on the left) and Process
chart with metric values (on the right).