Polar column chart
The Polar column chart type is a circular graph on which data points are displayed using the angle, and the distance from the center point. The X-axis is located on the boundaries of the circle, and the Y axis connects the center of the circle with the X-axis.
- In Studio, select Polar column and drag it to the View editor.
-
On the
Wizards screen, define
the data for the chart.
- Select the metric.
- Define the time and action.
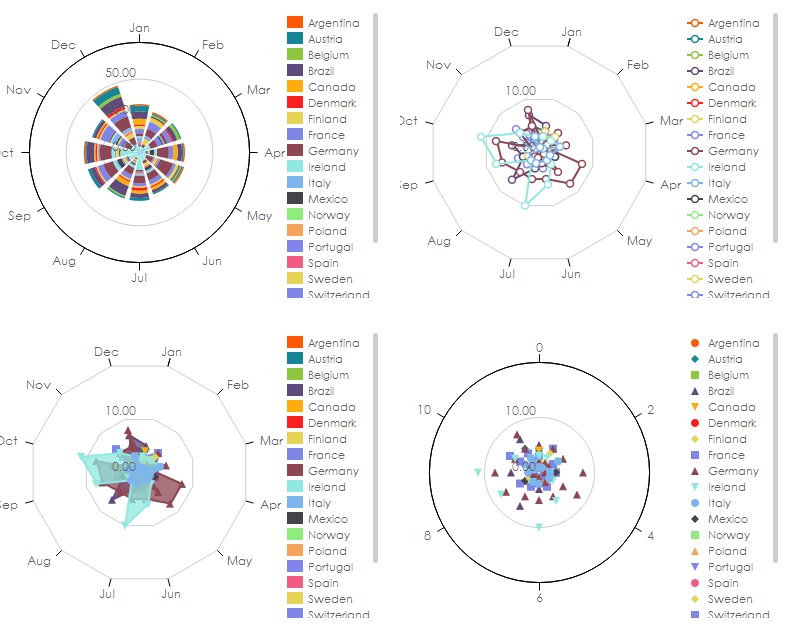
- Click the Display tab and define the display type. It can be either column, line, area or scatter. Also set other parameters for your chart.
-
Click
OK.