Trellis chart
A Trellis chart is a layout of smaller charts in a grid with consistent scales. Each smaller chart represents an item in a category. The data displayed on each smaller chart is conditional on items in the category.
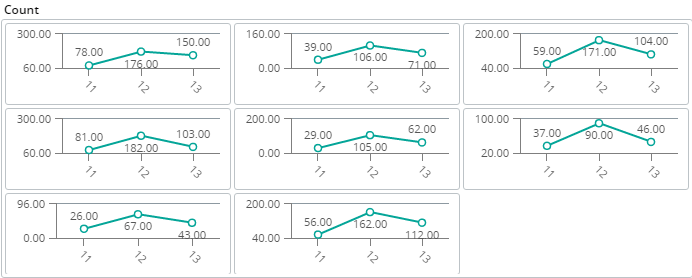
Trellis charts are useful for finding the structure and patterns in complex data. The chart represents a set of one-type charts that display the breakdown by any dimension.
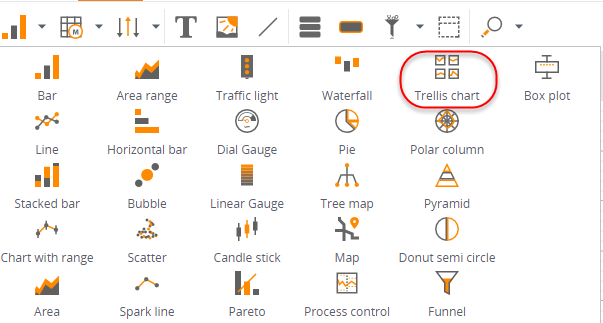
- In Studio, select Trellis chart and drag it onto the View.
-
On the Wizards screen, define data for the chart:
-
Inner component type
-
Breakdown
-
X-axis:
-
Items number
-
Resizable or not
-
Component width
-
Padding
-
-
Y-axis:
-
Items number
-
Resizable or not
-
Component height
-
Padding
-
-
- Click OK.