Properties of a Chart control
Use the following tabs to configure the properties of a Chart control.
General
| Name | Description |
|---|---|
|
Type |
The type of the control. |
|
Name |
A unique name for the chart. |
|
Security token |
Makes the information in the form secure. See Security tokens. |
|
Visible |
Makes the control visible at runtime. |
|
Session ID |
Global or form variable or form control that is used as session ID. |
Configuration
| Name | Description | ||||||||||||||||||
|---|---|---|---|---|---|---|---|---|---|---|---|---|---|---|---|---|---|---|---|
|
Title |
The title for the chart. |
||||||||||||||||||
|
Query |
The query that uses the chart control at runtime. Available options: Workqueue query, Job query, System query. |
||||||||||||||||||
|
Group by |
Groups the results returned from the query by selected field, such as group the results by the suspend reason so that you can see the total for each unique suspend reason. The Group by option is only available when you select a query. The fields available in the Group by list depend on the selected query. For example, if you select a Job query and group by job suspend reason, the total results returned per "suspend reason" are displayed on the chart at run time. The "suspend reason" is only recorded against the suspended jobs. If you select a System query and group by Suspend reason, the total results returned per suspend reason, and subsequently the active activities within that job are displayed on the chart. The "suspend reason" is only recorded against suspended jobs. If you group by machine, then the results per machine are displayed on the chart. For a Line chart, the Group by list only includes the following datetime options depending on the selected query.
For more information on the fields, see Job query, Work queue query, and System query. |
||||||||||||||||||
|
Time series |
The timeframe within which the data is collected for the selected query and "Group by" fields. The Time series option is only available when you select the datetime options in the Group by field. When you open a form at runtime, the count is displayed corresponding to the Group by list on the chart. For example, if you select the Workqueue query, "All activities", and group by "Activity due date", the following data is displayed at runtime.
When you select a System query and group by "Time pending", you can select the timeframe in hour, day, week, month, and year. At runtime, the count of the pending activities along with their pending times are shown in the chart based on the selected time series. For example, if you select "Hour" as "Time series" and there are total 10 pending activities; there could be 5 activities pending for 8 hours, 2 activities pending for 3 hours, and 3 activities pending for 1 hour. |
||||||||||||||||||
|
Number of segments |
The maximum number of segments (slices/bars/columns) displayed in the chart. |
||||||||||||||||||
| Refresh interval |
The interval at which the chart refreshes automatically. A value of 0 implies that the content is not refreshed automatically. |
||||||||||||||||||
| Chart type |
The type of chart: Bar, Pie, Column, and Line. (Default: Pie)
|
||||||||||||||||||
| Padding |
The space around the control (chart and legend). (Default: 0 for Top, Bottom, Left, and Right) |
||||||||||||||||||
| Inner padding |
The amount of padding applied to the inner chart excluding the legend. (Default: 5%) If you are import or upgrade a form from 7.9 or earlier versions, the default value for inner padding resets to 5%. |
||||||||||||||||||
| Legend position |
The position of the legend: Top, Bottom, Left, and Right. |
||||||||||||||||||
| Show legend |
If selected, displays the legend for the chart. (Default: Selected) |
||||||||||||||||||
| Show pie with donut |
If selected, displays the pie chart with a donut hole. (Default: Selected) |
||||||||||||||||||
| Show label |
If selected, displays the label text for the chart. |
||||||||||||||||||
| Label length |
The length of the label. (Default: 20) |
Dynamically get or set the properties of a Chart control
You can dynamically get or set the properties of the chart control. When you configure an action, such as Update control properties or Same page for the chart control, the following properties are available:
|
Property |
Description |
|---|---|
|
QueryId |
Holds the query ID of a chart control. |
|
GroupByField |
Returns "GroupByfield" query results on the chart. |
|
GroupByWorkTypeField |
Returns "GroupByWorkTypeField" query results on the chart. |
|
QueryType |
Returns the selected query type count. |
|
TotalReturned |
Returns total count of the query on the chart. |
|
DynamicFilterField |
When you select this property, the "Filter field" tab is available. All the filter fields are available depending on the selected query type and control. |
|
DynamicFilterValue |
Displays the selected filter value. |
|
DynamicQueryType |
Displays the value of the selected query type ( job query is 0, work queue query is 1, and system query is 3). |
|
ClickedSegmentTitle |
Returns the text displayed on the chart segment. |
|
ClickedSegmentCount |
Returns the number displayed on the chart segment. |
|
ClickedSegmentValue |
Returns the value corresponding to the group by fields on the chart segment. |
When you execute a form at runtime the properties of the control are updated as configured. For example, if you dynamically update the QueryID and GroupByField for the Update control properties action, the content in the chart control is updated accordingly. See Example 2: Get count, title and ID of a chart segment.
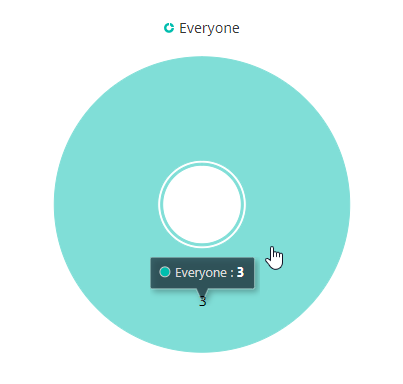
When you add a Clicked event to a Chart control, a hand cursor appears when you hover over the Chart. When you click the
Chart, the Clicked event is fired, and the configured actions are executed.

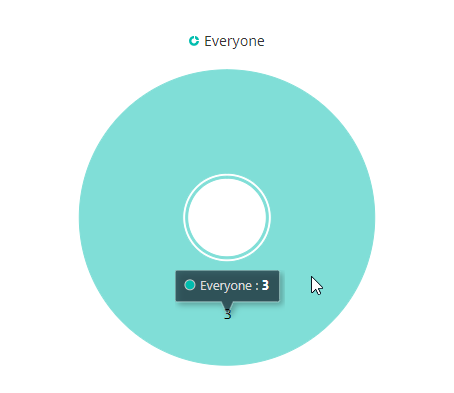
If the Clicked event is not configured, the cursor remains as the standard pointer arrow as shown below.
