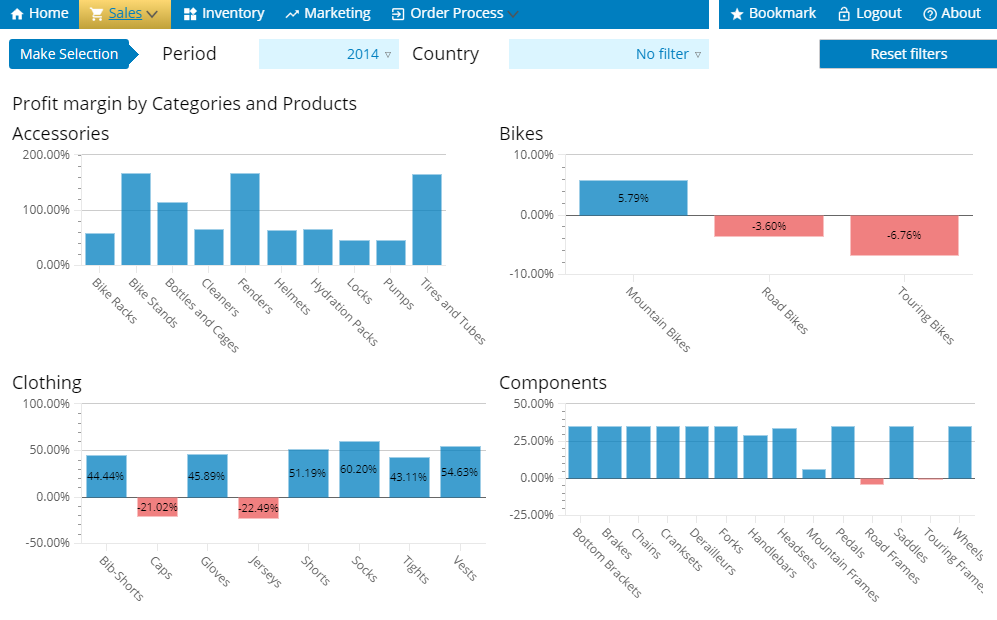
Profit Margin by Products
This dashboard hosts a single component (trellis chart) that shows four
different graphs: profit margin broken down by categories and products. The
titles of the charts specify categories (Accessories, Bikes, Clothing, and
Components) and each of them is broken down by products (against the
X-axis).
|
Charts / Filters |
Description and possible actions |
|---|---|
|
Period |
In ascending order, lists the periods by which you can filter
the View. Select each year (period) to apply to the View or use
|
|
Country |
In alphabetical order, lists the countries by which you can
filter the View. Select each country to include in the View, or click
|
|
Reset filters |
Resets all the filters to default values. |
|
Profit Margin by Categories and Products |
Displays the profit margin by categories and products in the form of four charts. Depending on the individual configuration, each chart supports either an automatic or manual drill down to the next level. |