Create a record grid
The AdventureWorks source database contains information about orders
placed by customers stored in tables. In this exercise, create a record grid
that shows the orders as in the sample screen below.
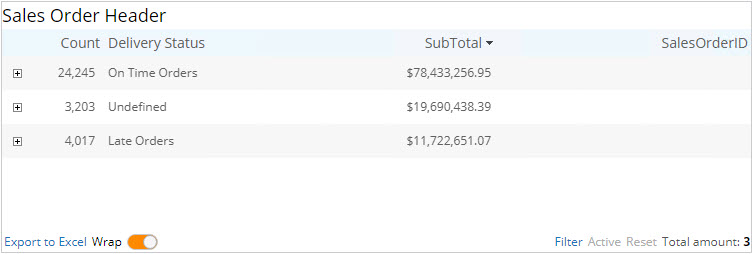
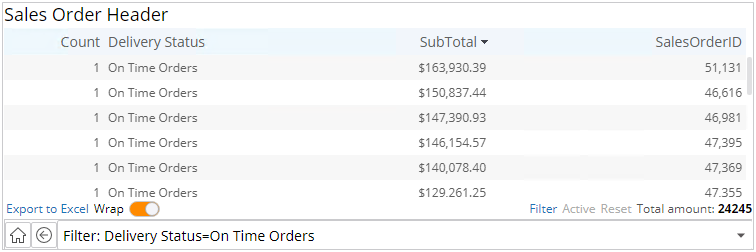
To expand the list of On Time Orders, click the plus sign in the Count
column.
In the Sample project, you can check a sample View with such a record grid created according to the procedures described below. You can open it and review all the configurations or create your own record grid for training purposes. To view the completed sample, on the Documents Tree, find the Sales Order Header and the Order Overview View.
To complete the exercise, do the following:
Create a data source
- In Studio, on the Documents Tree, right-click Data Sources and select New Data Source. Name the data source Adventure Works and click OK.
-
Define the connection to your server. Select the
Adventure Works
database.
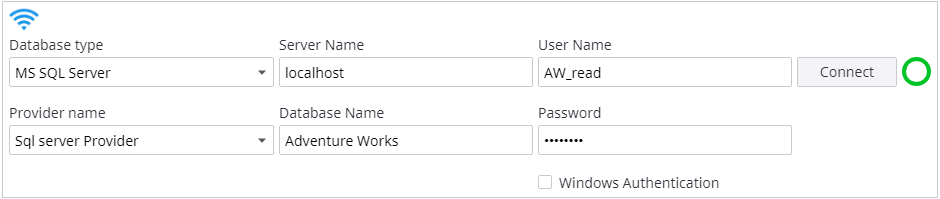
- To check that the connection is established correctly, click Connect. If everything is set up successfully, the circle next to the button turns green. If it is red, verify the data and try again.
-
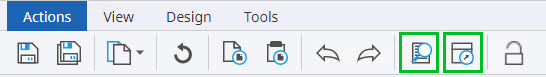
Click
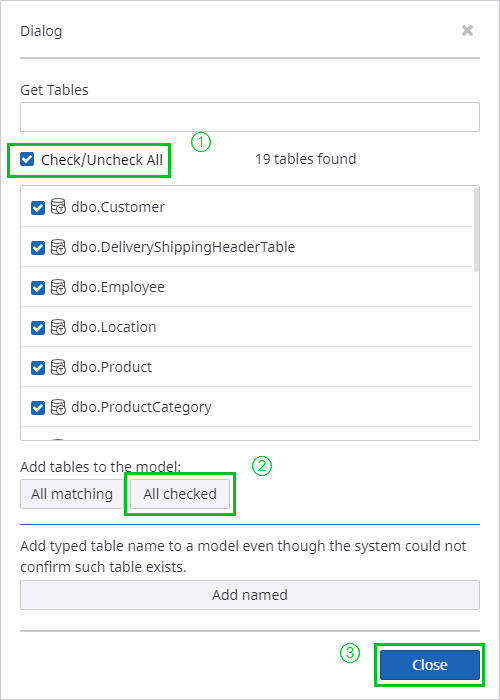
Get tables to get the
list of tables from the data source. In the Get Tables dialog, select
Check/Uncheck All and
click
All checked.
Click Close to close the window.
- Save the data source.
Create a record
- In Studio, on the Documents Tree, right-click Records and select New Record. Name the record Sales Order Header and click OK.
-
Add database tables as a source for the record.
- Click the plus sign in the Sources section and then the ellipsis in the Select new source section.
-
By default, the
Adventure Works
data source is already selected. Select
dbo.SalesOrderHeader.
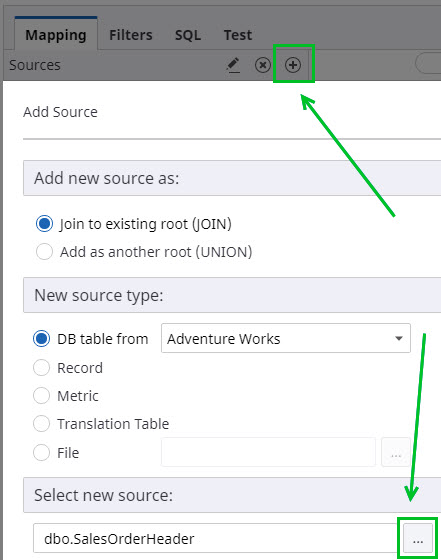
- Click OK.
Now all the fields from the selected tables are added to the list on the left.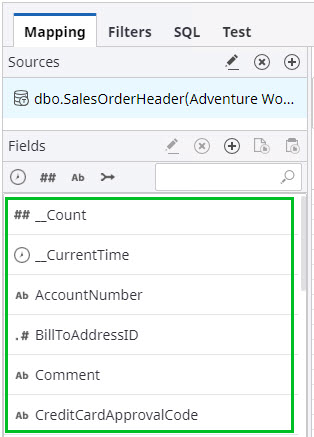
-
Select only the table fields required for the grid. Map the
following fields (drag from left to the right):
- SubTotal: For this field, you need to change the format. Highlight the field, in the Property Panel find Format, and select Currency. In this case, the dollar sign $ will be added to the numbers in the cells.
- SalesOrderID: This field shows the order ID.
- OrderReceive: Click Yes to accept using this field as the default time filter. This time field is needed to filter record data by this time stamp in the future and also to download incremental data to the project database.
-
Delivery status for the orders is not present in the source
tables, so it is required to calculate it based on the other fields that are
present. In Insight, such calculated fields that use expressions are called
derived fields. For this use case, you can create a derived
field that will indicate if the order is shipped on time or late.
-
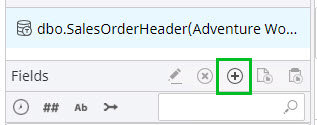
Click the plus sign in the
Fields section (Add
derived field).
- Change the field name to Delivery Status.
-
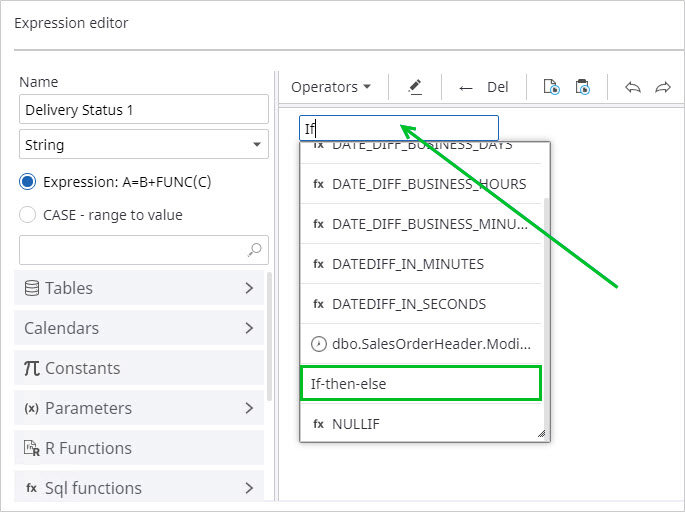
Start typing the expression as shown in the example. This
input field supports the IntelliSense technology and will help you to find the
right field or expression. Use the keyboard arrows to manage cursor position.
-
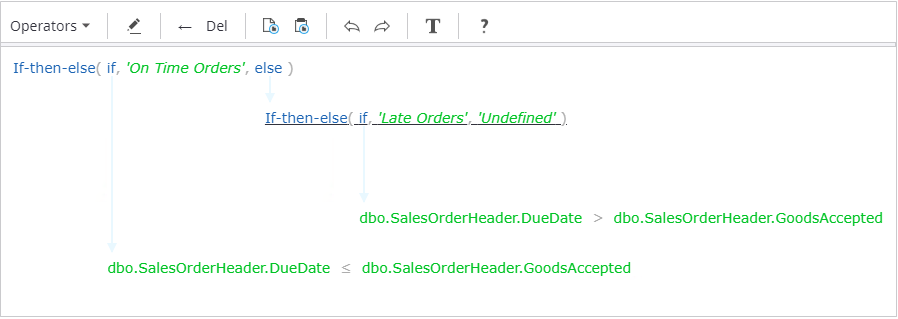
Provide an expression for calculation as shown in the sample
screen below. To add constant values (for example, On Time Orders), type the
value, press Enter, and then
OK.
- Click OK.
-
Click the plus sign in the
Fields section (Add
derived field).
- This field is now added to the left and you need to map it to the right.
- Save the record.
Create a View with the record grid
Create a View with the sample record grid based on the record created in the previous task.
-
On the
Documents Tree,
right-click
Views and select
New View.
Name the View Order Overview and click OK.
-
On the
View tab, expand the
Grids section, and drag a record grid to the canvas.
-
Configure the wizard.
- On the Data tab, select the Sales Order Header record from the Documents Tree by clicking the ellipsis. The list of record fields appears. Keep only Delivery Status, Subtotal, and Sales Order ID.
- In the sample grid, you need a column that shows the sum of orders. For this purpose, add an aggregate field. Click Add New Data, select Aggregate Field, and click OK. An aggregate field with the display name Count is added to the list.
-
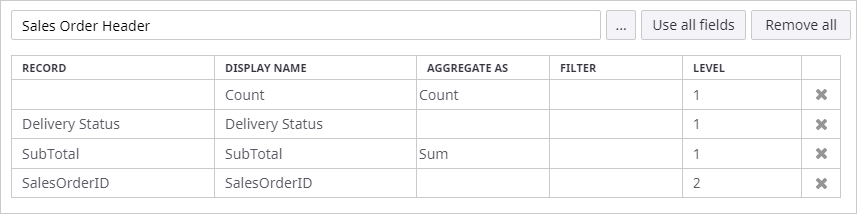
Change the order of fields, levels, and aggregation type
as shown in the sample screen below. The first level will show the number of
orders for each delivery status and the sum by the subtotals. The second level
will show all orders.
- For this exercise, you need to see all orders listed in the tables without any time limitations. On the Time tab, select Fixed time window from 1/1/1900 12:00 AM to 1/1/3000 12:00 AM.
- Set the sorting order of fields in the grid by subtotals in the descending order. Open the Display tab, on the Default order tab, click Add New Data, then click the empty cell under Sort by. Select Subtotal and set the order as Descending.
- Click OK.
-
Save the View, and open it in the Preview/Viewer.