Tooltip formats
Use this function to manage the appearance of tooltips, which display useful information or hints as a user moves the cursor over a specific dashboard component. You can assign a tooltip format on a per-component basis. For example, the tooltip format for a bar chart graph may differ from the format used in a candlestick chart.
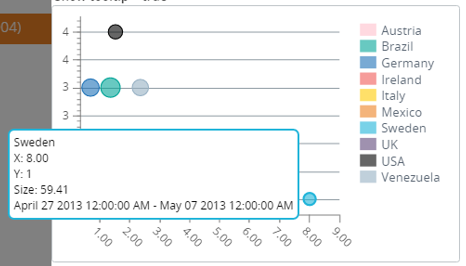
In the following example, the date range and dimension values appear in the tooltip when the user moves the cursor over a bubble on the bubble chart.