Report Manager plug-in: Dashboard
Note:
Do not confuse this plug-in with the SLA
Report Manager plug-in.
The is one of the Report
Manager's two sub-programs.

Under you can view
reports containing real-time data from the main
XBOUND database. The data is presented as gauges and diagrams that
can be moved around using drag and drop. You can also customize
the reports.
 Available
reports:
Available
reports:
|
| The total number of documents left
to process (all process steps). |
| Throughput in documents per hour
within the last hour. |
| Average throughput in documents per
hour. |
| Throughput in documents per hour
within the last hour in background (automatic) process steps. |
| Average throughput in documents per
hour in background (automatic) process steps. |
| Average throughput in documents per
hour in manual process steps. |
| Number of documents left to process,
grouped by . Settings allow you to select the client or
process for which to show the number of documents to be processed. |
| Average processing time per document,
grouped by processes. |
| Number of documents left to process
in backlog process steps. For an explanation of backlog,
see Configuring
a reporting category. |
| Document throughput within the last
hour. |
| Number of statistics synchronization processes that are waiting to be written to the statistics database. At the bottom you can also see the average synchronization time in milliseconds, and the date and time of the oldest item in the queue. |
Buttons:
|
| Updates all reports. |
| Click to select which reports to
display. |
|
( ) ) | Magnifies a report so that it uses
more of the screen. |
( ) ) | Reduces a report back to normal size.
|
| Click to customize a report. The
available settings depend on which report was selected – see
instructions.
|
| Updates the report with the latest
data. |
| This toggle button turns auto-refresh
on and off. The default auto-refresh time interval is 20 seconds. You can adjust
this by changing the value in the box next to the button. If the box is
not displayed, click the symbol next to the button and type a new value here: 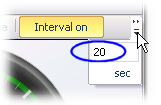
|
| Saves the report as an image file
– PNG, JPEG, GIF or BMP – in the location you specify. |

Under you can divide process
steps into .
 | Click to these buttons at the
bottom of the window to add a new reporting category or to
delete the selected one. |
An overview and instructions are provided in Configuring
a reporting category.
The following
built-in reporting categories are read-only:
– including these
activities:
– including these activities:
Interpretation (RCC)
Classification (RCC)
ABBYY FlexiCapture Extraction (RCF)
ABBYY FullPage Extraction (RCF)
RecoStar Professional Extraction (RCF)
RecoStar FullPage Extraction (RCF)
Create
Searchable PDF (ABBYY)
– including
this activity:

Under you assign
process steps to your reporting categories. For instructions, see Configuring
a reporting category.
Columns:
|
| Lists the in the selected . |
| The reporting category that (if present)
overrides the default reporting category. |
| The default category of the activity.
This is the category to which the process step is assigned
unless a different one is selected in the column. Tip: The default
reporting category can be changed in the dialog. |
| Select this option if the process
step is an endpoint of production. |
| If the process step is an endpoint of capture, select . When this option is selected, the fields can be evaluated and the documents can be
included in Capture Statistics and other reports. For more information about end points, see the overview
in Configuring
a reporting category. |
Related topics
Report Manager plug-in:
Reports
XBOUND plug-ins: Overview