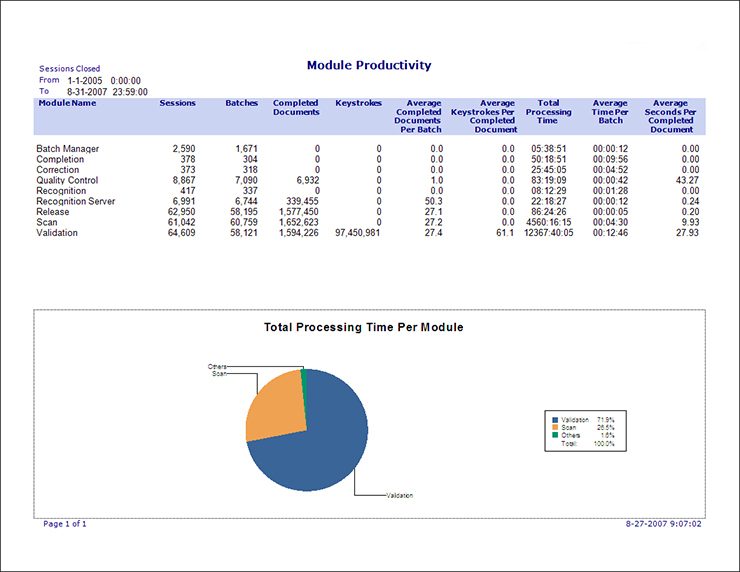
Module Productivity Report
Use the
Module Productivity report to evaluate the
efficiency of each module based on keystrokes, volume, and processing
times.

This report has the following components:
Selected Date Range
The report includes data for sessions closed during the specified date range.
Report Title
Lists the report the title (in this case
Module Productivity
).
Logo
Displays the default Kofax Capture logo, or a custom logo of your choice.
Column Headings
The Module Productivity report includes the following headings.
- Module Name
- Lists the names of the Kofax Capture modules.
- Sessions
- Lists the number of times a batch is either closed or suspended by the module.
- Batches
- Lists the number of unique batches that are suspended or closed by the module. For example, if a batch is suspended and then processed again, there are two sessions and one batch. If a document is rejected and its batch is sent to Quality Control, and then returns to Validation, there are two Validation sessions and one batch.
- Completed Documents
- Lists the number of documents completed during sessions. The
definition of a completed document depends on the module that processed it. The
following list explains when a document is considered to be completed.
-
Scan: The number of documents created during the session.
-
Recognition Server: The number of documents processed completely (documents opened, processed, and closed without errors in the process).
-
OCR Full Text: The number of documents processed completely (documents opened, processed, and closed without errors in the process).
-
PDF Generator: The number of PDF documents generated.
-
Validation: The number of documents indexed.
-
Verification: The number of documents where all the
verify fields
are verified. -
Quality Control: The number of documents reviewed and/or verified if
Require review of scanned pages
and/orRequire verification of form type
are selected. All pages or documents markedunrejected
are counted. Pages markedunrejected
and reviewed are counted. Documents markedunrejected
and verified are also counted. -
Export: The number of documents exported.
-
Custom Modules: Determined by the custom module. A completed document is one which has the
Completed
attribute set to true on the Document element.
-
- Keystrokes
- Lists the sum of all keystrokes for manual, OCR, ICR, OMR, and
bar code zones. The definition of a keystroke depends on the module used. The
following list explains how keystrokes are counted by each module.
- Scan, Recognition Server, OCR Full Text, PDF Generator, Quality Control, and Export: Always 0.
- Validation and Verification: The number of keystrokes entered in index fields.
- Custom Module: Determined by the custom module statistics attributes. Values are set in the ManualKeystrokes, OcrKeyStrokes, IcrKeyStrokes, OmrKeyStrokes, and BarKeyStrokes attributes of Document elements.
- Average Completed Documents Per Batch
- Lists the calculated average of the number of completed documents per batch (completed documents divided by batches). This result is rounded to the nearest decimal.
- Average Keystrokes Per Completed Document
- Lists the calculated average of the number of keystrokes per completed document (keystrokes divided by completed documents). This result is rounded to the nearest decimal. If no completed documents exist, this value is set to zero.
- Total Processing Time
- Lists the total time taken to process a batch (time from batch creation to batch close or suspend). This result is presented in hours, minutes, and seconds (rounded to the nearest second).
- Average Time Per Batch
- Lists the calculated average of the time spent processing a batch (processing time divided by batches). This result is presented in hours, minutes, and seconds (rounded to the nearest second).
- Average Seconds Per Completed Document
- Lists the calculated average of the time spent processing a document (time divided by completed documents). This result is presented in seconds. If there are no completed documents, this value is set to zero.
Tabular Data
The actual data that comprises the report. This data is based on the Module Productivity Report query.
Chart
A graphical representation of the tabular data. For the Module Productivity report, this is a pie chart that shows the total processing time per module. The modules that comprise 90% of the processing time are explicitly called out in the chart. The remaining modules are grouped under the "Others" label.
In the preceding example, there are 10 modules. The three largest modules are represented individually, while the rest are represented as Others.
Footer
Lists the page number, and the date and time the report is generated.
