Activity Breakdown dashboard
On the Activity Breakdown dashboard, you can view the automatic activities in more detail and monitor the work performed by the agents.
-
On the header bar, click
.
The Activity Breakdown page appears.
-
On the
Deployment list, select a deployment. (Default: Production)
The dashboard displays the following details:
-
All tenants, environments, and machines for the selected deployment. You can filter the data by Tenant, Environment, and Machine.
-
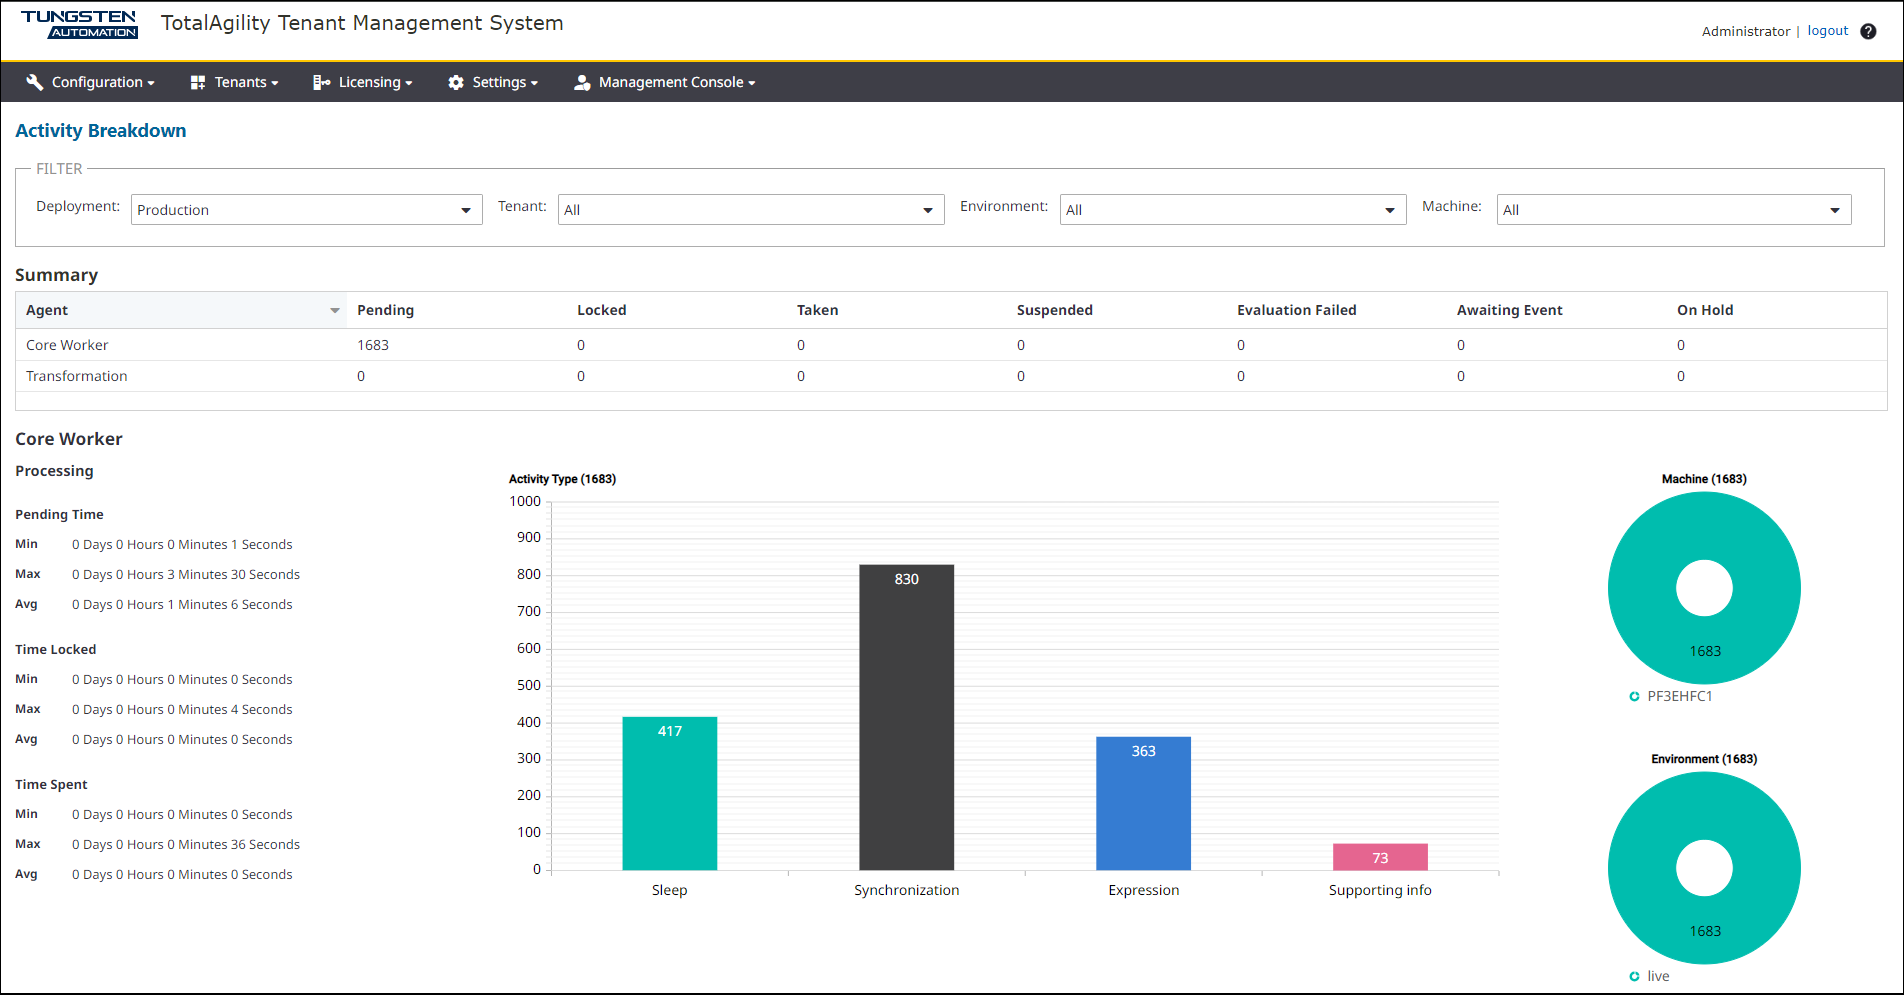
A Summary table with the number of activities and the status for Core Worker and Transformation agents.
-
-
From the
Summary table, select the row for
Core Worker or
Transformation.
For the selected item, the following details are displayed:
-
A pie chart with a breakdown of live activity status for pending, locked, taken, on hold, awaiting events, suspended, and evaluation failed activities.
-
A pie chart with a breakdown of machines involved.
-
A pie chart with a breakdown of activities per environment.
-
The details of minimum, maximum, and average pending time and locked time of activities.
By default, the dashboard is automatically updated every one minute. When you change the deployment, or filter the current deployment by tenant, environment, or machine, the dashboard is updated accordingly. See the following image that displays the activity breakdown for Core Worker.
-