Worker Task Throughput dashboard
Use the Worker Task Throughput dashboard to view worker task trends for a specific task type. This helps you monitor the work being performed for all tenants.
-
On the header bar, click
.
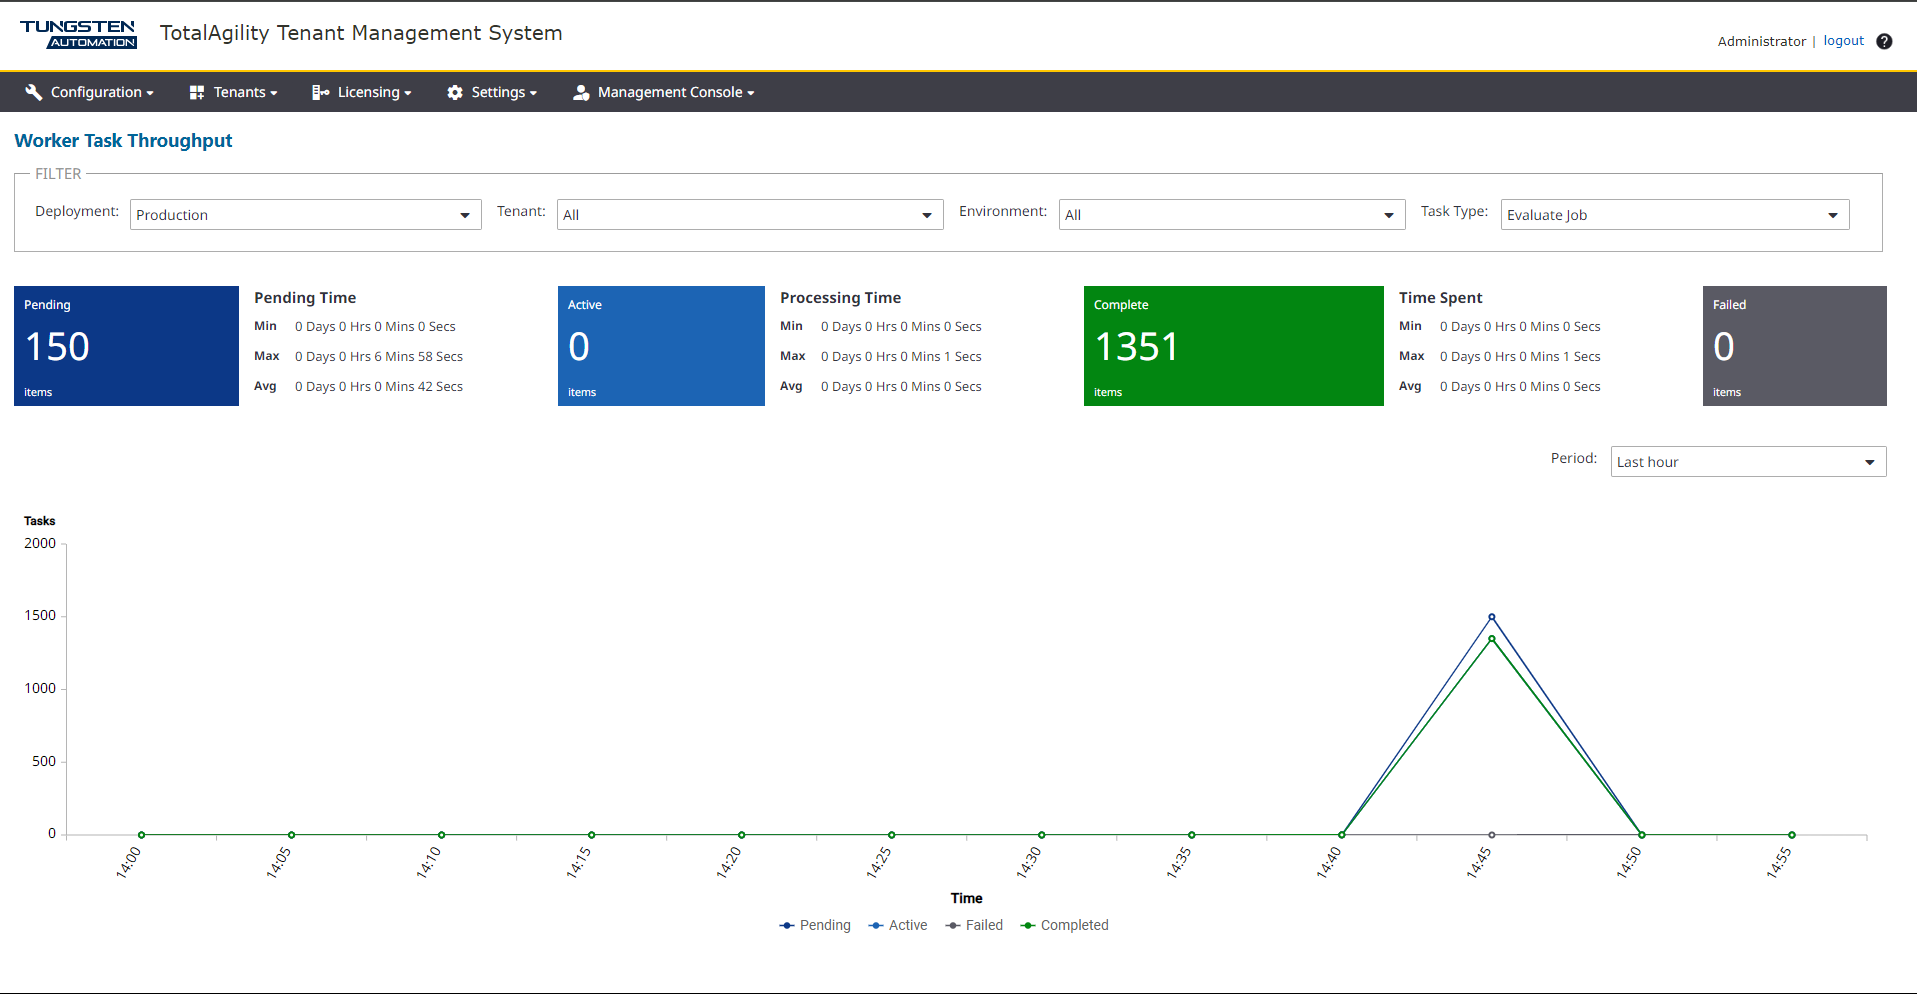
The Worker Task Throughput page appears.
-
On the
Deployment list, select a deployment. (Default: Production)
The dashboard displays the following details:
-
All tenants, environments and machines for the selected deployment. You can filter the data by Tenant. Environment, and Machine.
-
Separate tiles with the number of tasks in each status and the minimum, maximum, and average times.
-
A line chart depicting worker tasks over a specific time range per deployment.
-
The rate at which tasks become pending, locked, and completed.
-
A list of all worker task types. You can filter tasks based on type, status, and time range (including "All"). You can also filter based on tenant and environment.
By default, the dashboard is automatically updated every one minute. When you change the deployment, or filter the current deployment by tenant, environment, or machine, the dashboard is updated accordingly.
-