User Logons dashboard
Use the User Logons dashboard to view trends about user logons. This helps administrators to track user activity and ensure efficiency of the system.
-
On the header bar, click
.
The User Logons page appears.
-
On the
Deployment list, select a deployment, such as Deployment1. (Default:
Production)
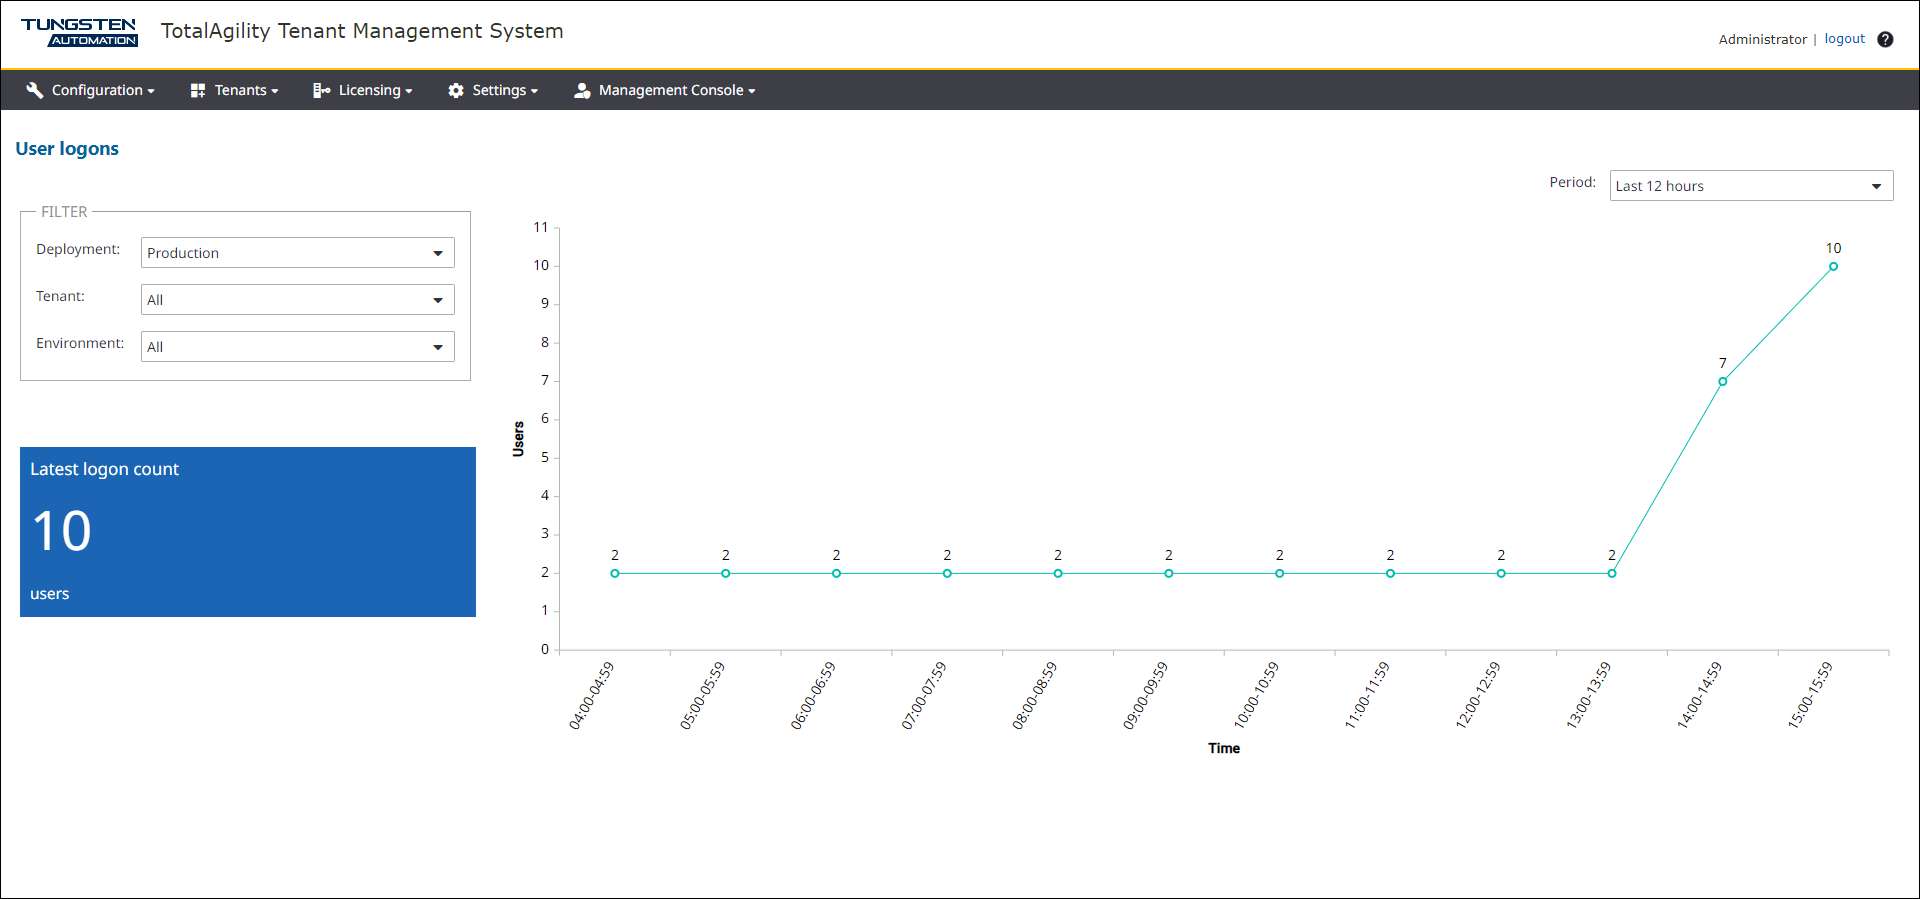
The dashboard displays the following details:
-
All tenants and environments for the selected deployment. You can filter the data by Tenant and Environment.
-
A tile with the latest number of logged on users.
-
A line chart with number of logged on users over a selected period.
-
The points on the chart are spaced one hour apart for up to 24 hours, and anything greater will use the number of days as the interval. For example, for 7 days, the interval is 7 hours.
-
-
On the
Period list, select the period, such as Last 7 days, for which you want to
get the statistics. Available options are: All (default), Last 4 hours, Last 8 hours, Last 12 hours, Last 24 hours, Last 2 days,
Last 5 days, and Last 7 days.