Worker Task Overview dashboard
Use the Worker Task Overview dashboard to view a high-level overview of pending worker tasks. This allows to monitor the work being performed for all tenants and quickly identify any issues. Worker tasks should be processed promptly; otherwise, it may indicate an issue with the system task that executes them.
-
On the header bar, click
.
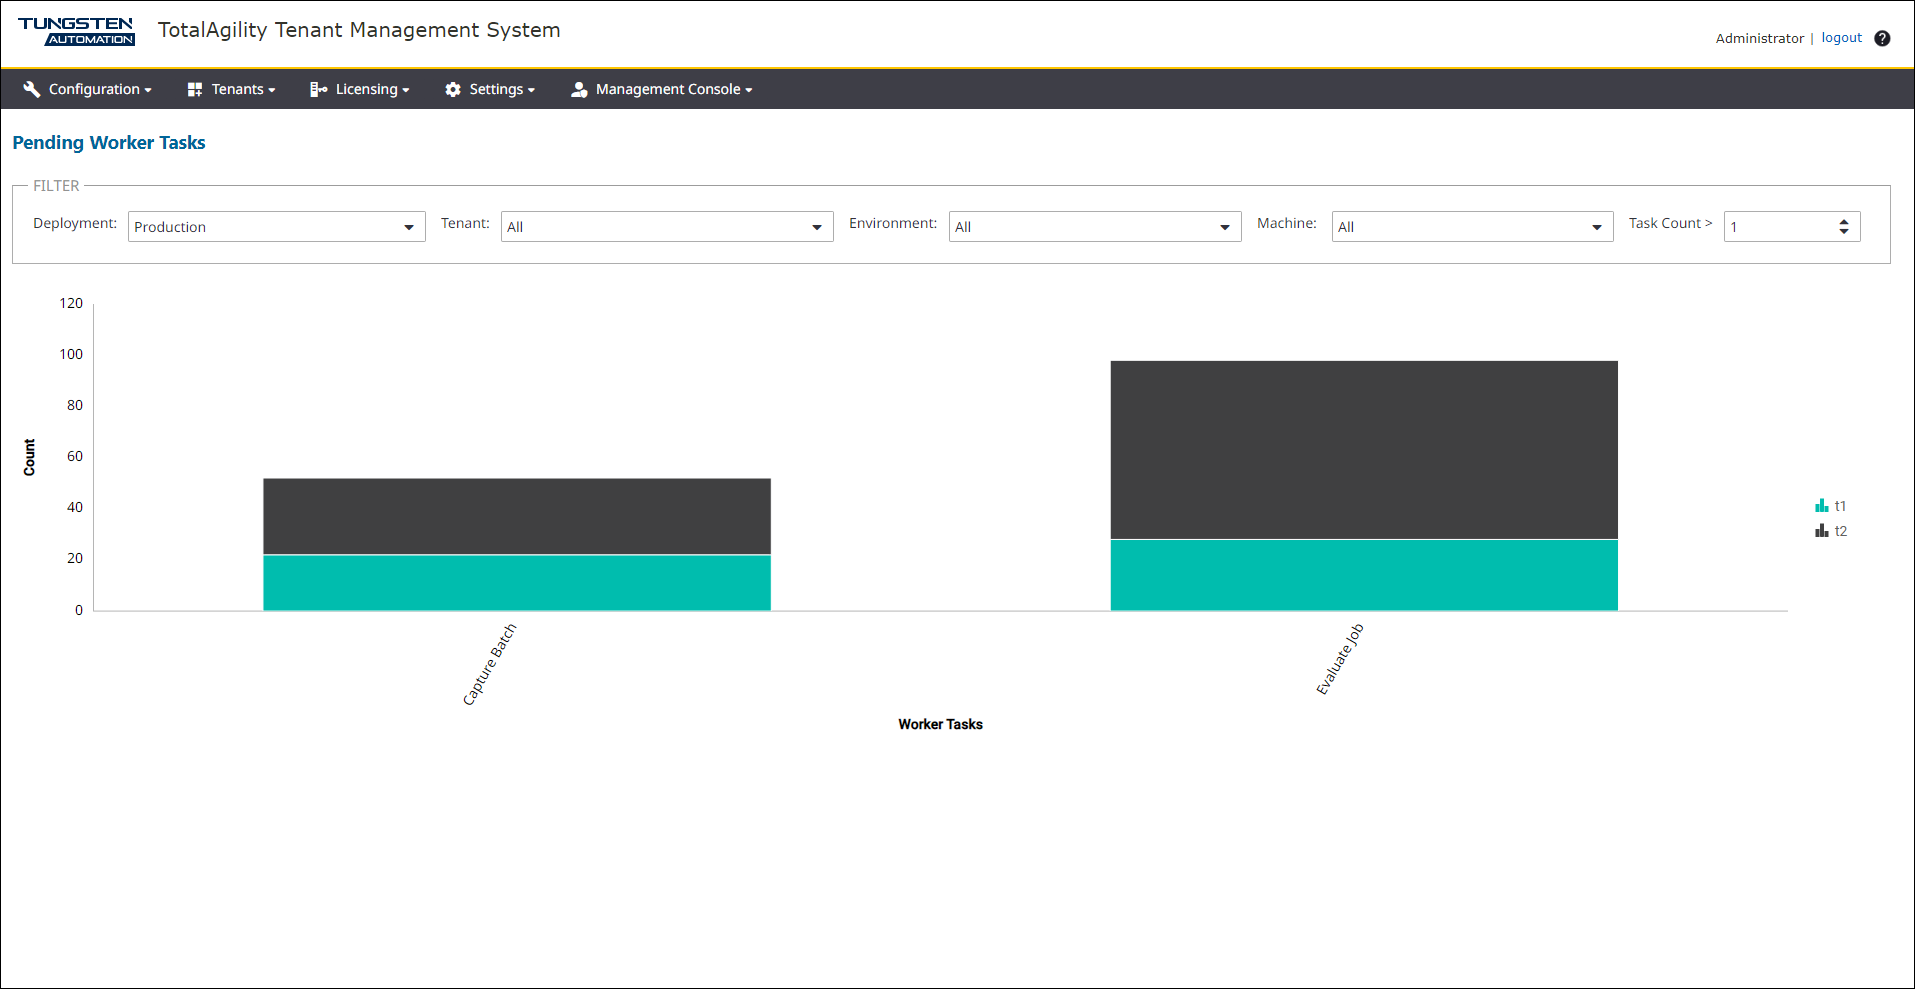
The Pending Worker Tasks page appears.
-
On the
Deployment list, select a deployment. (Default: Production)
The dashboard displays the following details:
-
All tenants and environments for the selected deployment. You can filter the data by Tenant and Environment, Machine, and Task Count (Default: 2000, Minimum: 1, and Maximum: 50,000).
-
A stacked bar chart with number of pending worker tasks that exceed the task count per tenant. The X-axis represents the type of task, the y-axis indicates the number of pending tasks, and the bars are stacked per tenant with a legend.
-
If the number of tasks for a specific worker type is less than the specified count (for example, 2000), it is excluded from the chart.
By default, the dashboard is automatically updated every one minute. When you change the deployment, or filter the current deployment by tenant, environment, or machine, the dashboard is updated accordingly. When you click on a bar in the chart, you are redirected to the worker task page, and the selected task type and tenant are selected on the dashboard.
-