Documents Processed dashboard
Use the Documents Processed dashboard to view the usage trend of transformation volume for document processing analysis.
-
On the header bar, click
.
The Documents Processed page appears.
-
On the
Deployment list, select a deployment, such as Deployment1. (Default:
Production)
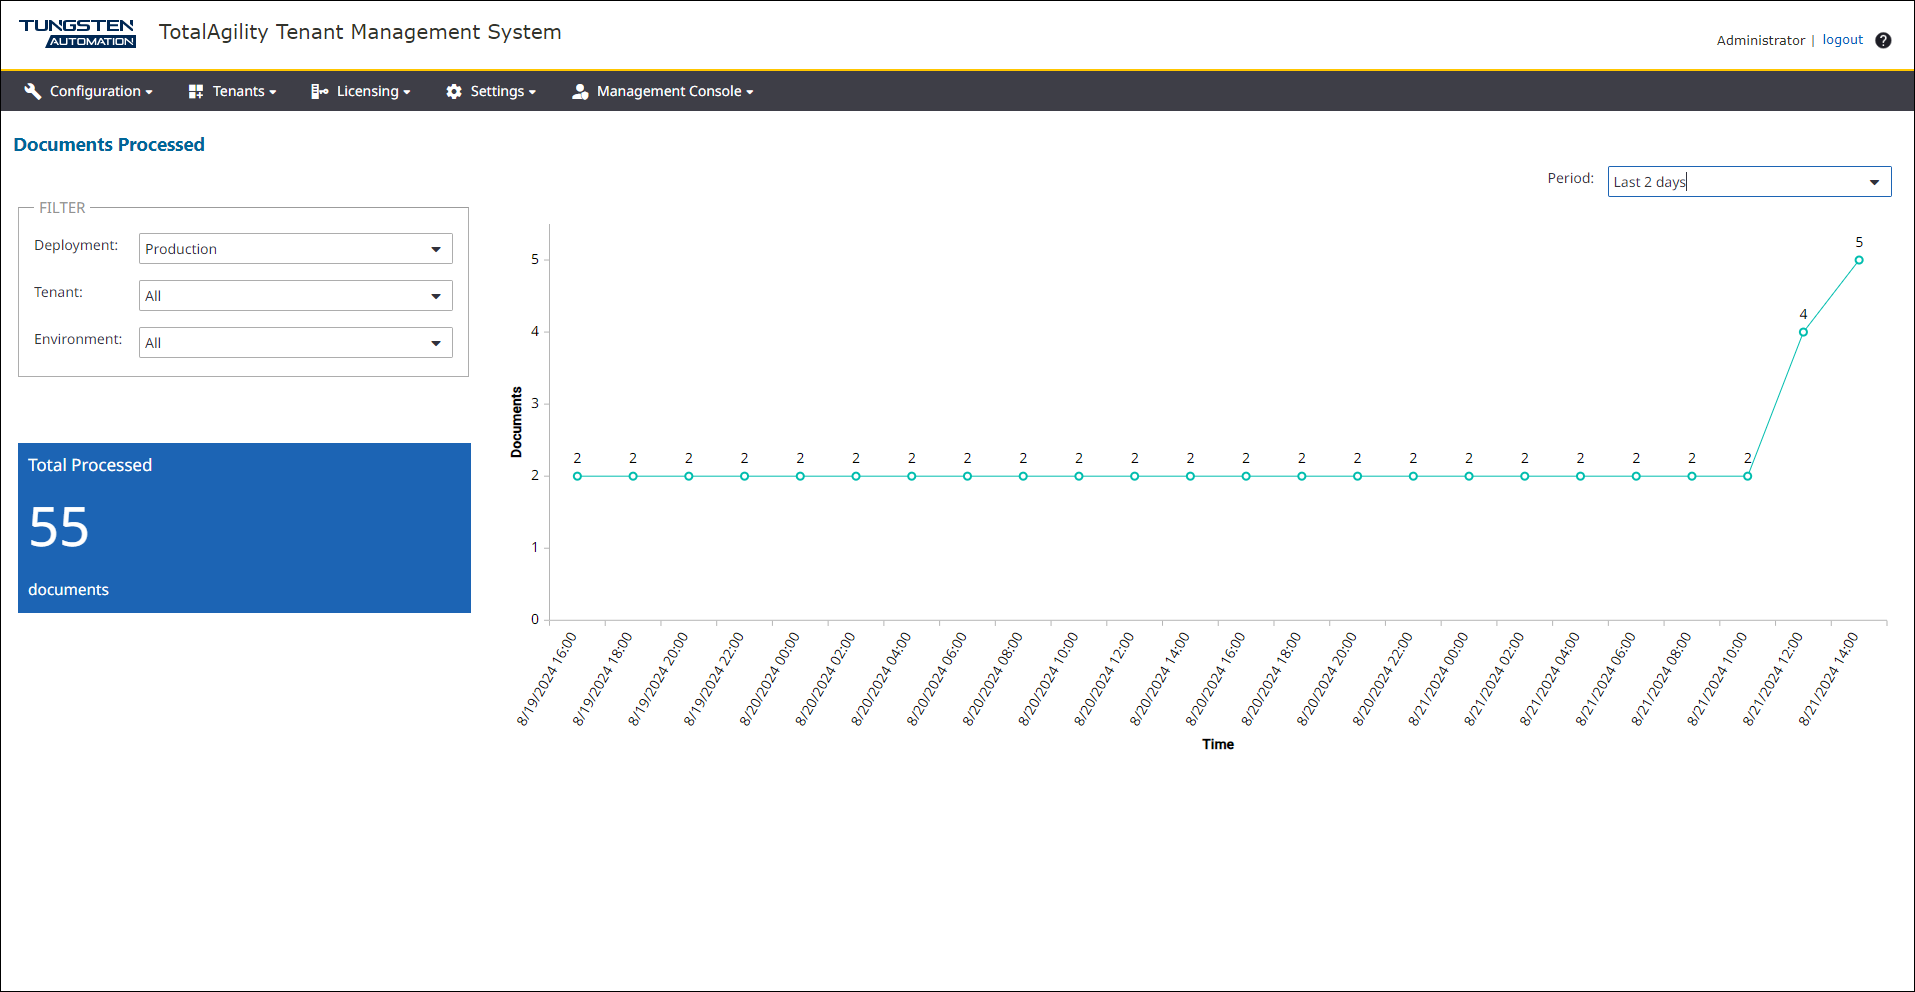
The dashboard displays the following details:
-
All tenants and environments for the selected deployment. You can filter the data by Tenant and Environment.
-
A tile with the total number of documents processed.
-
A line chart with number of documents processed over a selected period.
-
-
On the
Period list, select the period, such as Last 7 days, for which you want to
get the statistics. Available options are: All (default), Last 4 hours, Last 8 hours, Last 12 hours, Last 24 hours, Last 2 days,
Last 5 days, and Last 7 days.
By default, the dashboard is automatically updated every one minute. When you change the deployment, or filter the current deployment by tenant, environment, or time, the dashboard is updated accordingly.