Activity Overview dashboard
On the Activity Overview dashboard, you can view the live automatic activities for all tenants.
-
On the header bar, click
.
The Activity Overview page appears.
-
On the
Deployment list, select a deployment. (Default: Production)
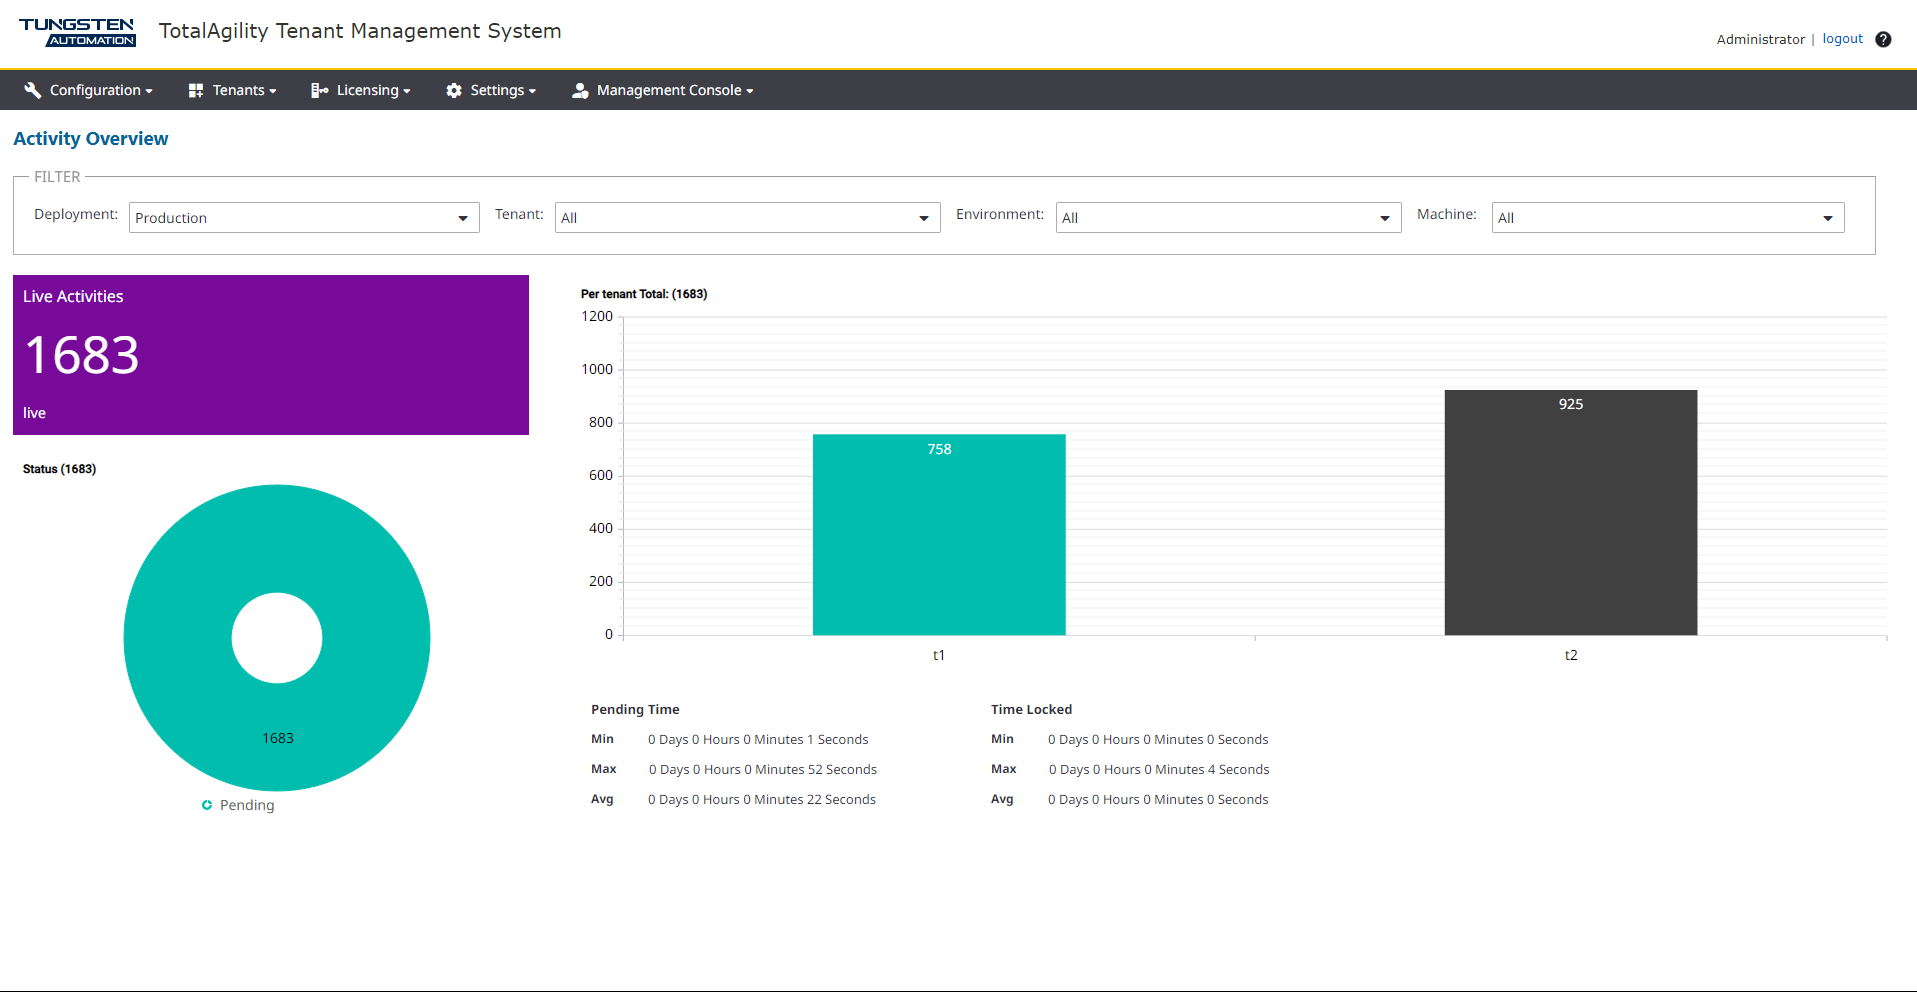
The dashboard displays the following details:
-
The tenants and environments for the selected deployment. You can filter the data by Tenant, Environment, and Machine.
-
A tile with the number of live activities.
-
A pie chart with the breakdown of live activity status (pending, locked, taken, on hold, awaiting events, suspended, and evaluation failed).
-
A bar chart with the number of activities per tenant.
-
The details of minimum, maximum, average pending time, and locked time of activities.
By default, the dashboard is automatically updated every one minute. When you change the deployment, or filter the current deployment by tenant, environment, or machine, the dashboard is updated accordingly.
-