Home
The landing page for the Sample project analytics project demonstrates
multiple Insight functions. The elements on the Sample landing page are
intended for demonstration purposes and should not be taken literally. The
screen shows four graphs that might be of key interest for a sales company:
Revenue, Revenue by Top Marketing Promotions, Courier Performance, and Stock
Levels for top 5 Products.
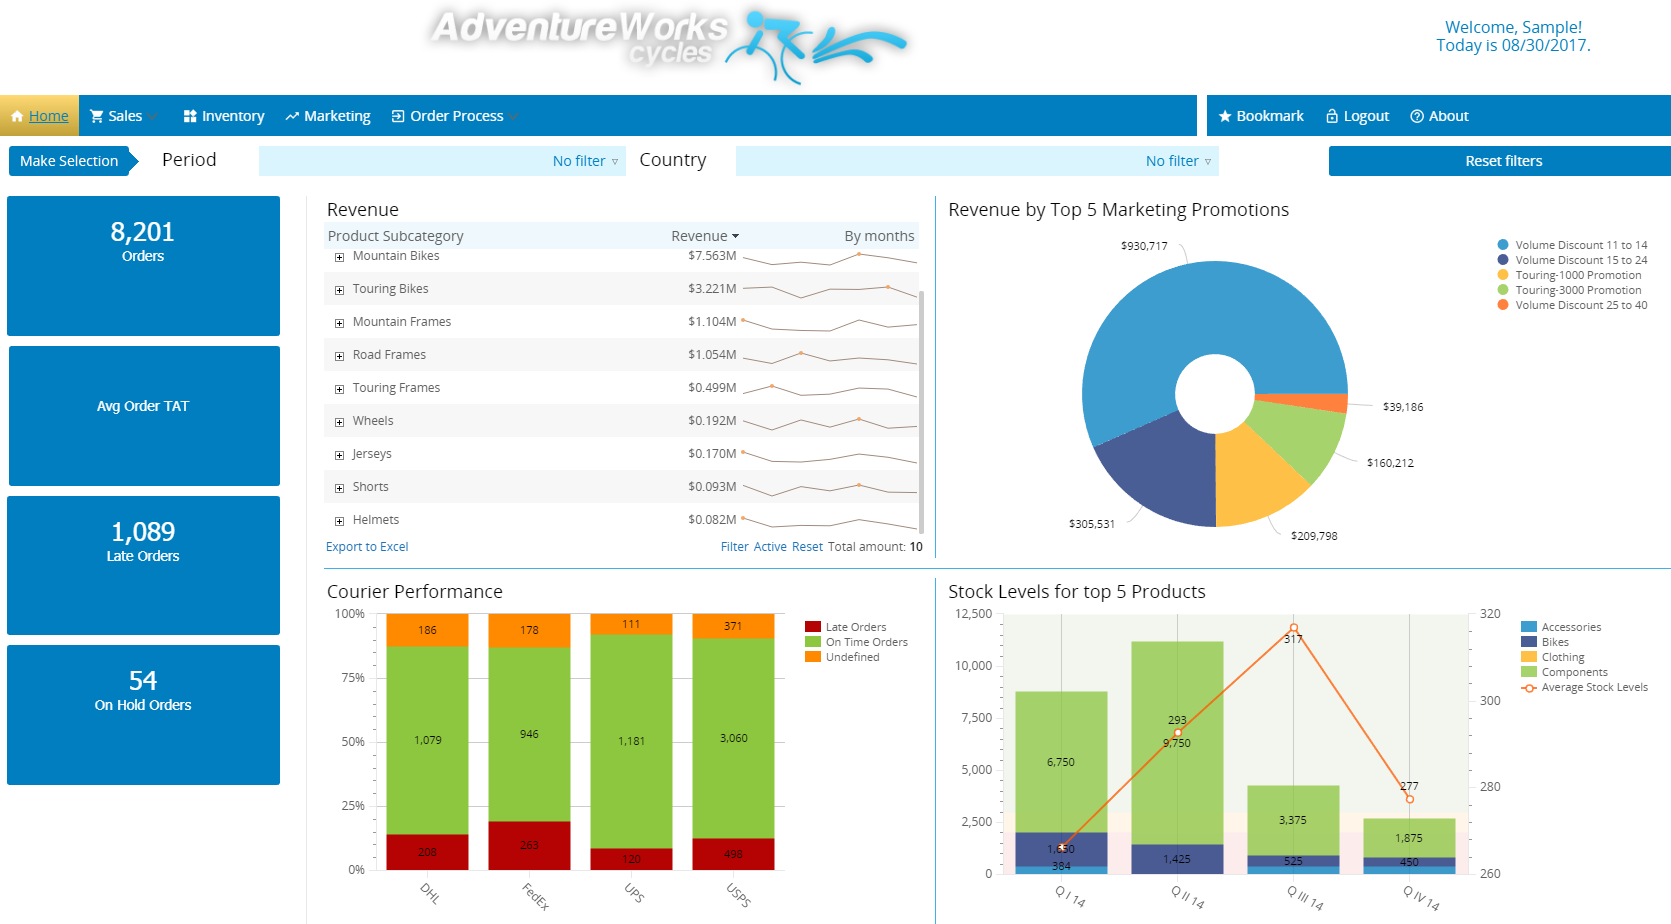
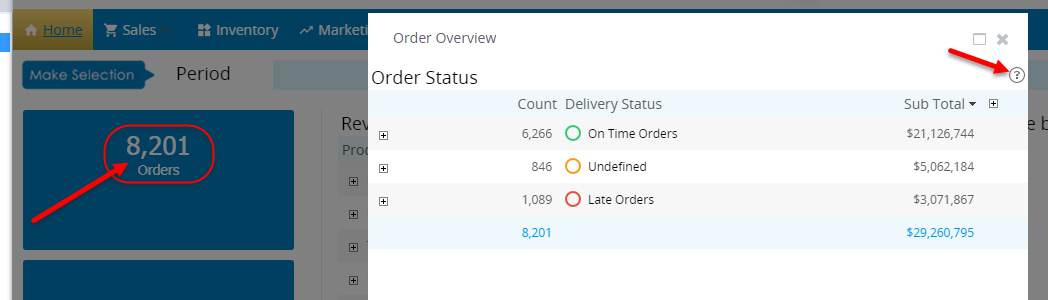
On the left in the View, the four blue buttons show the general sales numbers. Click any button to open a pop-up window that lists additional details in a grid or chart. This new View gives a detailed overview of the selected value, for example, in a form of a record grid.
You can perform multiple actions associated with this grid to analyze
the data: drill down, filter, see the details pop-up window, and more. Also,
the information icon displays possible actions with the component.
|
Chart/ Grid / Filter / Button |
Description and possible actions |
|---|---|
|
Orders |
Click the button to see how the overall number of orders is broken down by status. Click the plus sign to view the orders associated with any status. Then, you can click any order to see more details. |
|
Avg Order TAT |
Click the button to see the average turnaround time for processing orders (in days). At the first grid level, some of the columns remain empty (Delivery Status, Sales Order ID, and Shipping Method ID): they are populated with data only when you drill down to other levels. |
|
Late orders |
Click the button to see late orders grouped by the order turnaround time. Drill down to see more details about each order. |
|
Incomplete Orders |
Click the button to see a grid with all incomplete orders broken down by customers. Drill down to see more details about each order. |
|
Period |
In ascending order, lists the periods by which you can filter the View. Select each year (period) to apply to the View or use "No filter" to show all data available. Also,"Custom interval" gives you an option to adjust the required time interval. |
|
Country |
In alphabetical order, lists the countries by which you can filter the View. Select each country to include in the View, or click "All" to include all countries. Click "Clear" to remove all country selections. Click "OK" to confirm your choice. |
|
Reset filters |
Resets all the filters to default values. |
|
Revenue |
Displays the revenue grouped by product subcategories and also a sparkline to see the revenue trend by months. Drill down to see more details about each subcategory. |
|
Revenue by Top 5 Marketing Promotions |
Displays the revenue grouped by top 5 marketing promotions. If you click any promotion on the pie chart, it automatically drills down based on the Sales Last Name. |
|
Courier Performance |
Displays the performance of orders grouped by courier companies. In this chart, no automatic drill down is configured: you need to manually select the required piece of data and in the subsequent pop-up window, specify the drill-down preferences. |
|
Stock Levels for Top 5 Products |
Displays the stock levels for top 5 products grouped by quarters. In this chart you can zoom on any part on the time line: use the mouse click and release it to drag to the end of the required period. |