Create a process and process chart
The goal of this exercise is to create a process that will visually
represent the life cycle of an order processed by the Adventure Works Cycles
company.
Note See the
Kofax Insight Studio Help for more information on the
description of the chart.
Based on this process, you will create a process chart. Do the
following:
Create a process
- On the Documents Tree, right-click Processes and select New Process. Name the process Order Process and click OK.
- On the canvas of the process editor, right-click and select Generate steps.
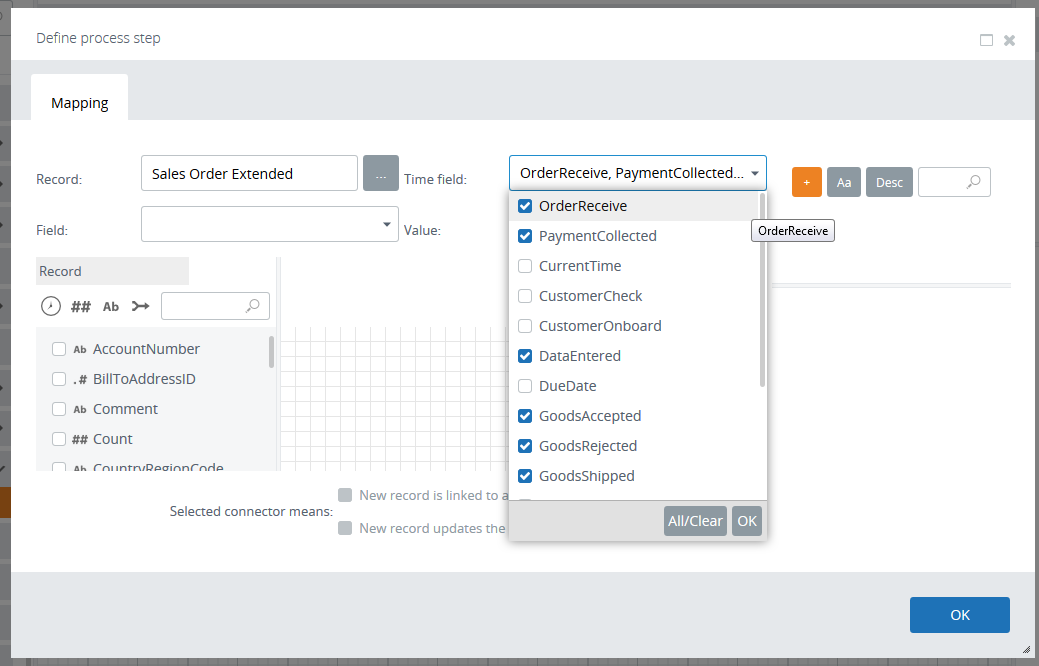
- On the Define process step screen, add the source record by clicking the ellipsis icon. Select the Sales Order Extended record.
-
For the
Time field, select the
following fields and click
OK:
- OrderReceive
- PaymentCollected
- DataEntered
- GoodsAccepted
- GoodsRejected
- GoodsShipped
- OrderRejected
- Restock
- StockChecked
- StockPacked
-
Map the SalesOrderID (drag from left to the right).
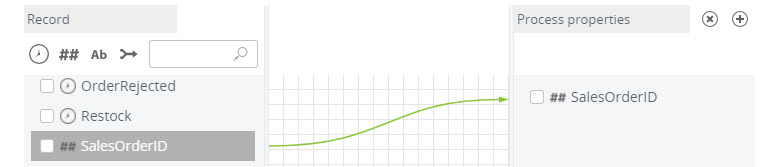
-
Select SalesOrderID on the left and select the
New record is linked to a process
by that field check box.
This field is now mapped from right to left.Note If the connection is bi-directional, Insight tries to find an existing process instance with the given identifier. If such an instance is not found, the new process instance is created and the value of the record field is set as the identifier.
-
Click
OK.
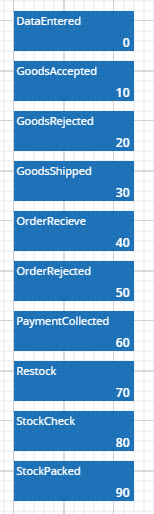
All the new steps are generated. The numbers inside the boxes are step IDs that are assigned automatically and cannot be changed.
-
Now you need to specify the starting and finishing steps for the
process.
- For OrderReceive in the Property Panel, select Is start step.
- For GoodsRejected, Restock, and PaymentCollected, in the Property Panel select Is finish step.
-
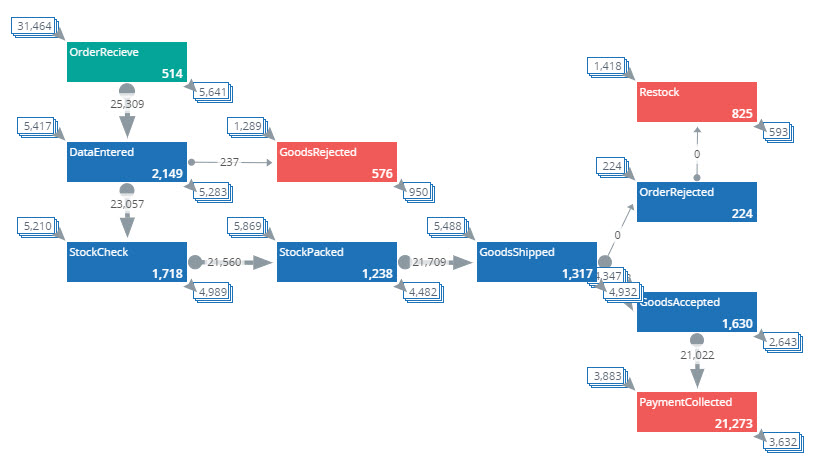
Re-order the boxes on the canvas as shown below and link the
steps by dragging the cursor from the green circle of one step to the similar
circle of the other step.
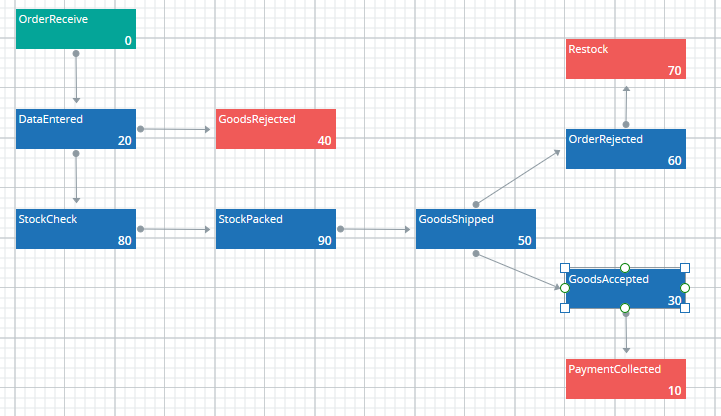
This is the process that shows the life cycle of an order. However, the order may follow its path in another order and in this case the order is counted as "Violated," which means breaking the preset order. -
Save
 the process.
Load data
Now you need to load the data. For this purpose, create an execution plan.
- On the Documents Tree, right-click Execution Plans and select New Execution Plan. Name it Load process data and click OK.
-
Note Our process is built on the on-demand record, which means no record data is present in the Data DB. To proceed, you need to upload the record to a temporary table and then upload the process.In the plan editor, click the plus sign and select Add Record group.
- Select the Sales Order Extended record.
- Click the plus sign again and select Add Process group.
- Select the process created above.
-
Save
the execution plan and
click
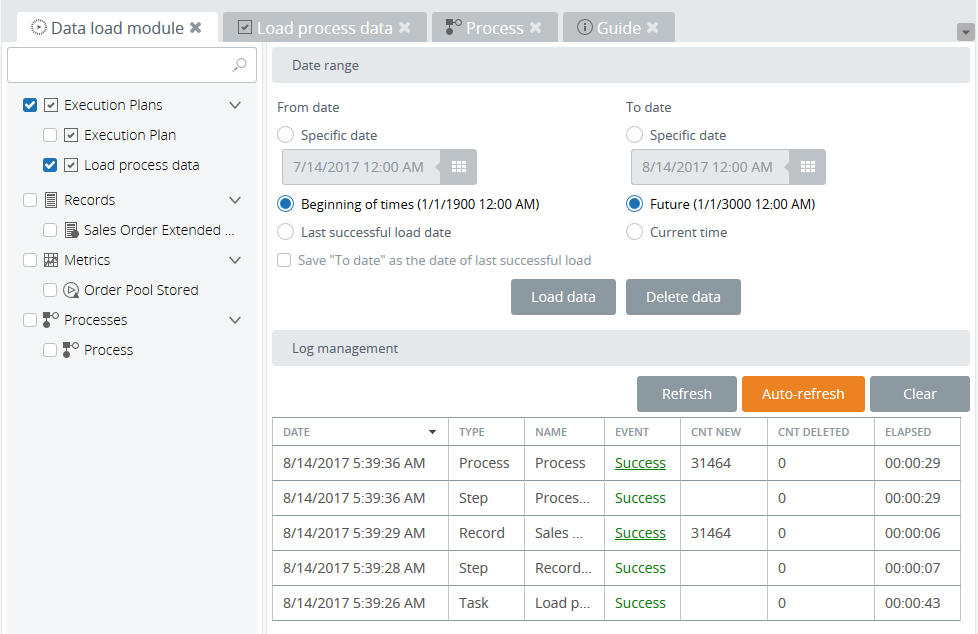
Data load.
- In the time editor, select Beginning of times (1/1/1900 12:00 AM) and Future (1/1/3000 12:00 AM).
-
Click
Load data. While the
plan is running, the status of each step is displayed in the Log management
pane. Wait for the plan to finish successfully.
Create a process chart
- Create a new View and name it Process chart.
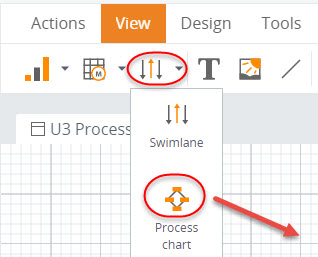
-
Drag a process chart to the canvas.
-
Configure the wizard.
- On the Data tab, select the Order process.
- On the Time tab, select Fixed time window and set it from 1/1/1900 12:00 AM to 1/1/3000 12:00 AM.
- Click OK.
-
Save
the View and open it in
the Preview/Viewer.
Completing this
exercise, you are now able to set up a visual process that a business unit
normally undergoes during the business cycle (for example, an order) . Then,
based on this process, you can create a chart that shows the overview of how
the orders are distributed between the process milestones and if they follow
the process precisely.
Note In Insight, such units are called process instances.