Revenue Summary
Use the Revenue Summary View to perform an in-depth analysis of the
sales data and the revenue. The data representation varies from a grid to chart
and from a sparkline to geographical map.
|
Charts / Filters |
Description and possible actions |
|---|---|
|
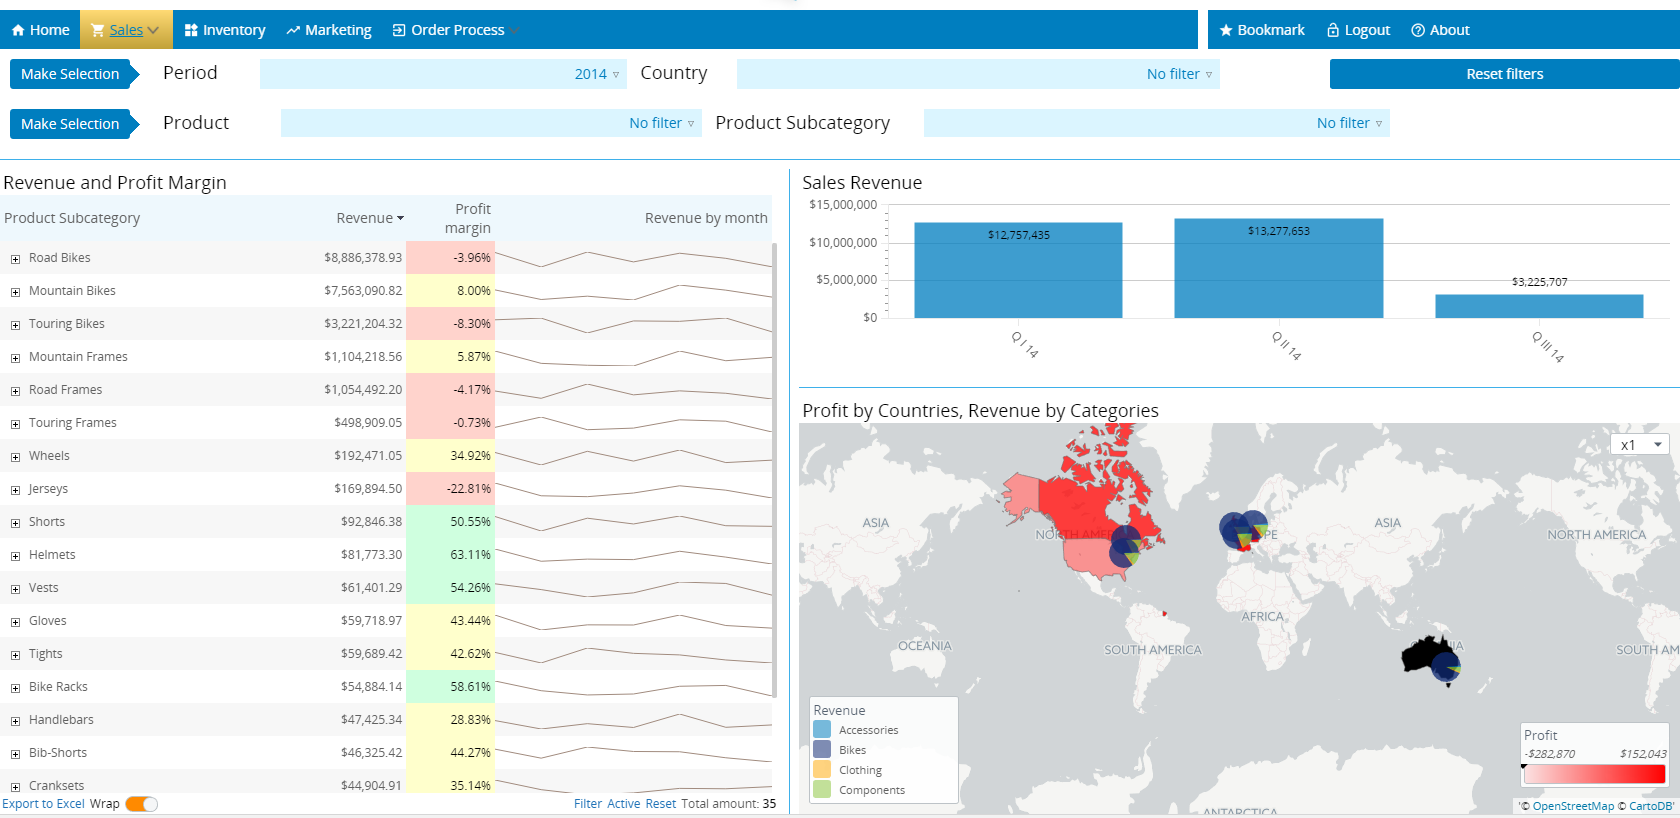
Period |
In ascending order, lists the periods by which you can filter the View. Select each year (period) to apply to the View or use "No filter" to show all data available. Also, "Custom interval" is available to adjust the required time interval. |
|
Country |
In alphabetical order, lists the countries by which you can filter the View. Select each country to include in the View, or click "All" to include all countries. Click "Clear" to remove all country selections. Click "OK" to confirm your choice. |
|
Reset filters |
Resets all the filters to default values. |
|
Product |
In alphabetical order, lists the products by which you can filter the View. Select each product to include in the View, or click "All" to include all products. Click "Clear" to remove all product selections. Click "OK" to confirm your choice. |
|
Product Subcategory |
In alphabetical order, lists the product subcategories by which you can filter the View. Select each subcategory to include in the View, or click "All" to include all subcategories. Click "Clear" to remove all selections. Click "OK" to confirm your choice. |
|
Revenue and Profit Margin |
Displays revenue, profit margin and the revenue trend by months grouped by product subcategories. Drill down to see more details about each subcategory. The Profit Margin column shows the conditional coloring: red for profits below 0% (negative), yellow for profits between 0 and 50%, and green for profits over 50%. |
|
Sales Revenue |
Displays sales revenue grouped by quarters. In this chart, no automatic drill down is configured: you need to manually select the required piece of data and then in the subsequent pop-up window specify the drill down preferences. |
|
Profit by Countries, Revenue by Categories |
Displays the profit by countries (distinguished by the color intensity) and revenue by categories. The pie charts serve as pins: one pin per each country. |