Use auto metrics and standard metrics
In the previous exercises, you learned how to create records and then configure components based on these records. Now you can advance to creating auto-metrics and metrics.
Use auto metrics to calculate data directly from the record. In this respect, they are more simple to use than metrics: the data can be used without creating any separate documents (metrics). In this example, you will learn how to calculate the same data in two different ways: by auto-metrics and by metrics.
A metric is a number (a KPI) that shows a particular aspect of operations for an enterprise: for example, Order Count or Revenue. Metrics in Insight are separate documents and can be used for charts and grids.
To complete this exercise, you need to do the following:
Prepare the record
Pre-requisites: copy the Sales Order Header record and name it Sales Order Extended. This record has the SubTotals field that shows the revenue for the given Order: to calculate the revenue, you will use an auto-metric that sums up these subtotals.
-
Map all the fields in this record: click the first field on the
left, hold down the Shift key, scroll down the list, and click the last field
in the list.
All the fields are selected.
- To mark all the fields, press the spacebar.
- Map all the fields from left to the right.
-
Add
dbo.SalesTerritory.
- Click the plus sign in the Sources section.
- In DB tables from, select Adventure Works.
- In the Select new source section, click the ellipsis icon, select dbo.SalesTerritory, and click OK.
- In the Define condition section, remove all conditions except for TerritoryID.
- Click OK.
- In the Sources section, map CountryRegionCode to the right.
-
Save
 the record.
Create a View with a metric grid based on auto metrics
- Create a new View, name it Metric Grids, and click OK.
-
Drag a metric grid to the canvas.
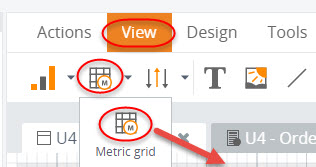
-
Configure the wizard.
-
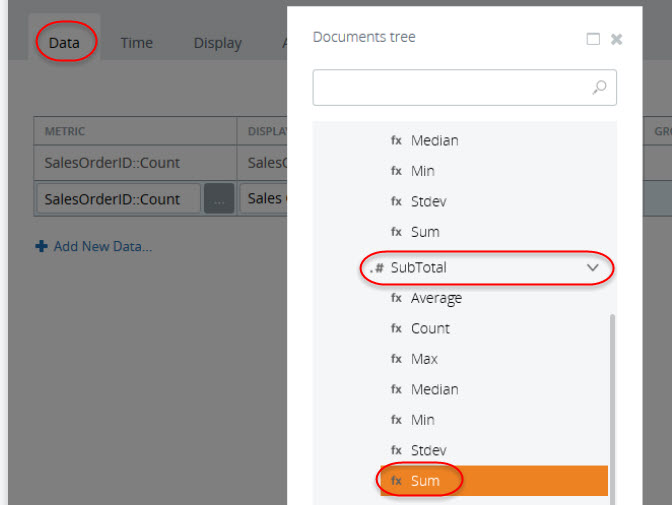
On the
Data tab, highlight
the
Metric cell and
click the ellipsis icon. Navigate to
.
Also, add another auto metric: click
Add New Data,
select
and click
OK.
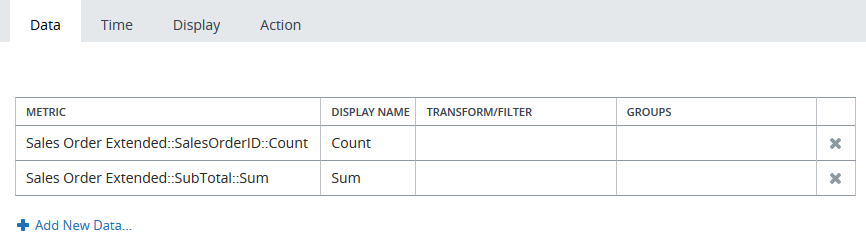
To make the column names more meaningful, you can change the Display Name for each. Open the Data wizard and change the names to Revenue and Order Count. Click OK.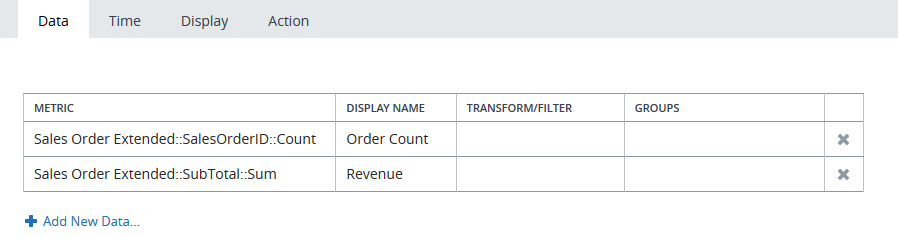
- On the Time tab, select Fixed time window and set it to Beginning of times (1/1/1900 12:00 AM) and Future (1/1/3000 12:00 AM).
- On the Display tab, under Axis and drill down, select CountryRegionCode to show as rows.
- Click OK.
-
On the
Data tab, highlight
the
Metric cell and
click the ellipsis icon. Navigate to
.
Also, add another auto metric: click
Add New Data,
select
and click
OK.
-
Save
the View and open it in
the Preview/Viewer.
The grid has two columns that represent auto metrics: one calculates the sum and the other calculates the number of orders per each country.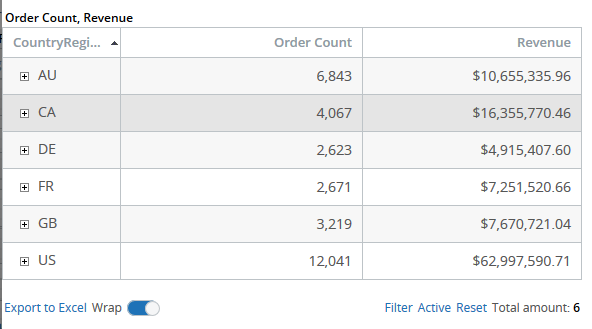
Create a metric
Create a standard metric when you know that you will need it for multiple components, and you need to keep the calculation configuration for a later usage. You can always return to this metric definition and edit it later: all the changes will be reflected in all the dependent components simultaneously. However, if you need to use the metric only once, it is more convenient to use auto metrics.
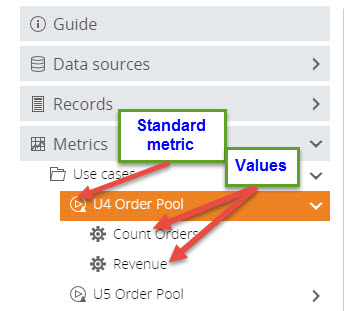
In general, when you create a standard metric in Insight, it
consists of different values (Revenue, Order Count) and dimensions (Country,
Delivery Status). Inside of a single standard metric you can add as many
dimensions and values as required. On the
Documents Tree, they
are differentiated as shown below.
Now you will create the same standard metrics that you created earlier as auto metrics: Revenue and Count Orders.
- In Studio, on the Documents Tree, right-click Metrics and select New Metric. Highlight Standard Metric, name the metric Order Pool, and click Create.
-
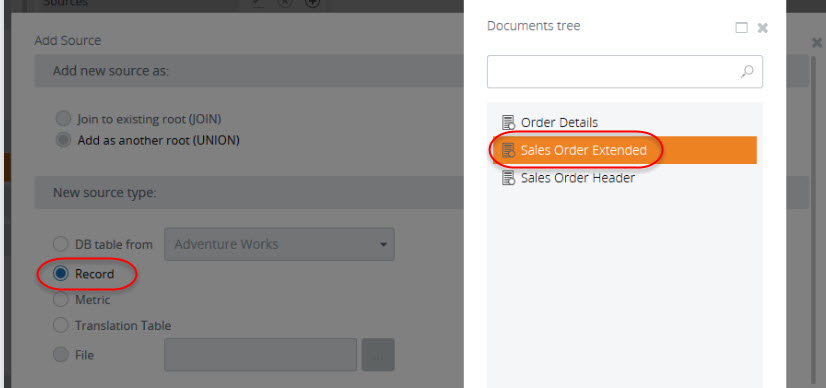
Click the plus sign in the
Sources section to add
the source for the metric and select the
Sales Order Extended
record. Click
OK and then
OK again.
-
Map the following fields (drag from left to the right):
- OrderReceive (Click Yes to accept using this field as the default time filter.)
- SubTotal
- SalesOrderID
- CountryRegionCode
- DeliveryStatus
-
Highlight SubTotal and make some adjustments.
- Find Purpose in the Property Panel and change it to Value. The Sum label is automatically added to the green arrow that indicates mapping: it means the aggregation is added to the dimension.
- Find Display Name in the Property Panel and change it to Revenue.
- Find Format in the Property Panel and change it Currency.
- To add aggregation to the SalesOrderID dimension, highlight the plus sign on the connection arrow and select Count. Also, find Display Name in the Property Panel and change it to Order Count.
-
Save
the metric.
Add a metric grid based on metrics
- On the same View as described in Create a View with a metric grid based on auto metrics, drag a new metric grid to the canvas.
-
Configure the wizard.
- On the Data tab, highlight the Metric cell and click the ellipsis icon. Select the metrics created above: Order Count and Revenue (by clicking Add New Data). Click OK.
- On the Time tab, select Fixed time window and set it to Beginning of times (1/1/1900 12:00 AM) and Future (1/1/3000 12:00 AM).
- On the Display tab, under Axis and drill down, select CountryRegionCode to show as rows.
- Click OK.
-
Open the View in the Preview/Viewer.
The grid based on these metrics shows exactly the same data as the first grid built on the auto metrics.