Advanced usage
In the Test results section, you can
-
View the final outcome of the training-testing process in the Main panel, Confusion matrix and Total statistics sections
-
Open the Calculate best confidence threshold dialog by clicking the Calculate best confidence... button
-
Mark the Show percentage values checkbox to display test results in percentage instead of integer values in the Confusion matrix
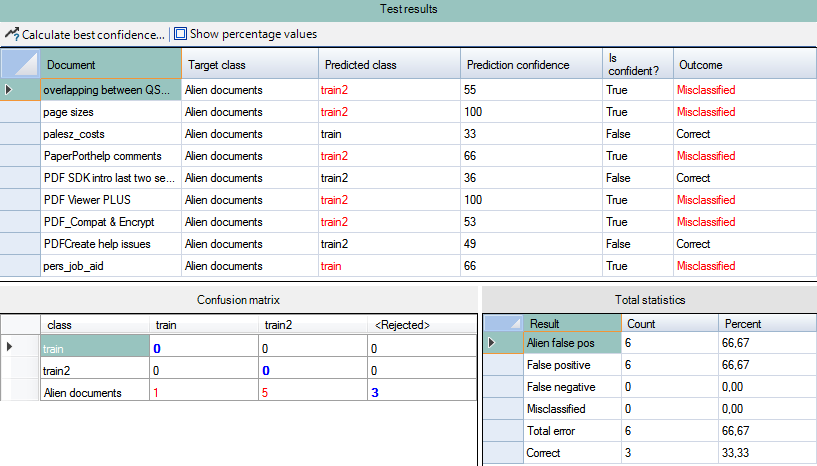
Before a test document set is processed, the Main panel is empty. After processing the test document set, the test results are displayed in a table see above:
| Column name | Description |
|---|---|
| Document | Name of the tested document |
| Target class | The reference class to which the current test set is compared |
| Predicted class | Name of the class to which the current test set matched |
| Prediction confidence | Confidence value of the prediction |
| Is confident? | Whether the prediction confidence is high or low based on the prediction confidence value, available values are True and False |
| Outcome | Result of the test process; available values are Correct, LowConfidence and Misclassified. The actual value depends on the Confidence threshold value. |
The display order can be changed by clicking the table headers.
Confidence threshold
The Confidence threshold value determines the final outcome of
the training-testing process. Use it for fine-tuning the
Outcome column of the Test results
section. The ultimate aim is different with each document set: 
-
If your documents belong to the same categories with minimal or no differences in layout, you can set it to 0 or close to 0 to have the greatest number of Correct results
-
If your documents involve significant differences in layout that might not fit in any of your classes, go for a value of 50 or higher to have the greatest number of LowConfidence or Misclassified results
-
If your documents possibly feature a mixed set of layouts and you are uncertain as to the proper ratio of those belonging to your classes and those not fitting in them, experiment with the values to identify one that suits your purpose
Take advantage of being able to reorder the rows of the Test results table for a structured view of the results. This way you can better notice subtle differences the various Confidence threshold values cause and you can find the proper value much easier.
Confusion Matrix
The Confusion matrix summarizes the test results in the form of integers and shows the correlation among the Target class, Predicted class and Outcome columns of the Test results table, in accordance with the Confidence threshold value.
-
Red values indicate the number of matches between two classes with LowConfidence or Misclassified result.
-
Blue values in bold indicate the number of those matches that have a Correct result.
-
Black values mean that no matches are identified by the application
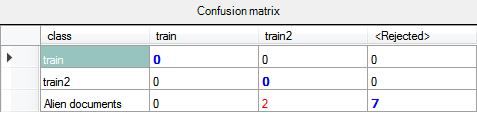
Columns show the target class, rows show the predicted class. The <Rejected> column corresponds to the FalseNegative error weight in the Calculate best confidence threshold dialog.
Reorder the rows by clicking the table headers.
Calculate best confidence
Click the Calculate best confidence... button to launch the
Calculate best confidence threshold dialog for
automatically configuring the Confidence value based on the
three Weights values (FalseNegative,
FalsePositive and
MisClassified).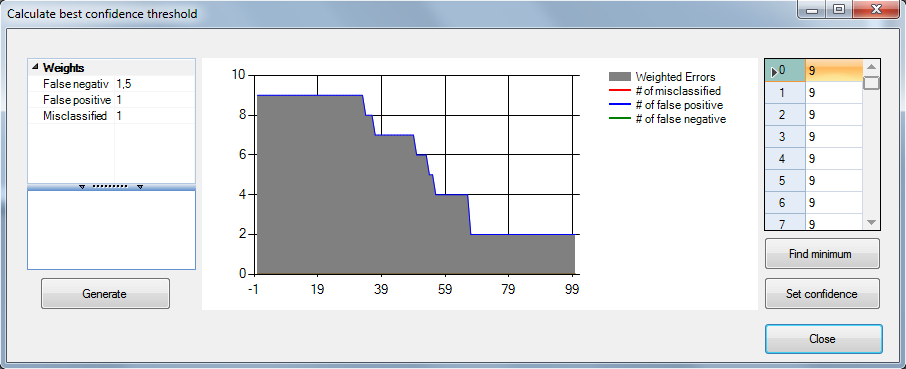
Weights
In order to construct a test document set with the desired number of possible errors, the following weight values are available for generating a chart of the weighted errors:
| Error type | Description |
|---|---|
| False negative | Weight for a non-alien document matched by alien |
| False positive | Weight for an alien document matched by a class |
| Misclassified | Weight for a non-alien document matched by wrong class |
Enter the desired weight values in the Weights table and click the Generate button to draw a chart for the weighted errors. The vertical axis stands for the error and the horizontal for the Confidence threshold.
You should always assign the highest number to the most problematic error weight.
Click the Find minimum button to locate the smallest error value in the Confidence threshold -error table. Click the Set confidence button to apply the selected confidence threshold. Alternately, you can double-click any of the value rows to apply it to the test results.
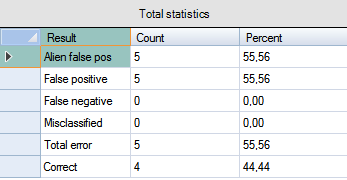
Total Statistics
This table displays the data pre-configured in the Calculate best confidence threshold dialog. The final result of the training-testing procedure fine-tuned by the Confidence value is displayed as numeric data (Count) and percentage (Percent). The Total error and Correct values provides a more specific summary of the process.