
How to interact with the Printix Power BI report
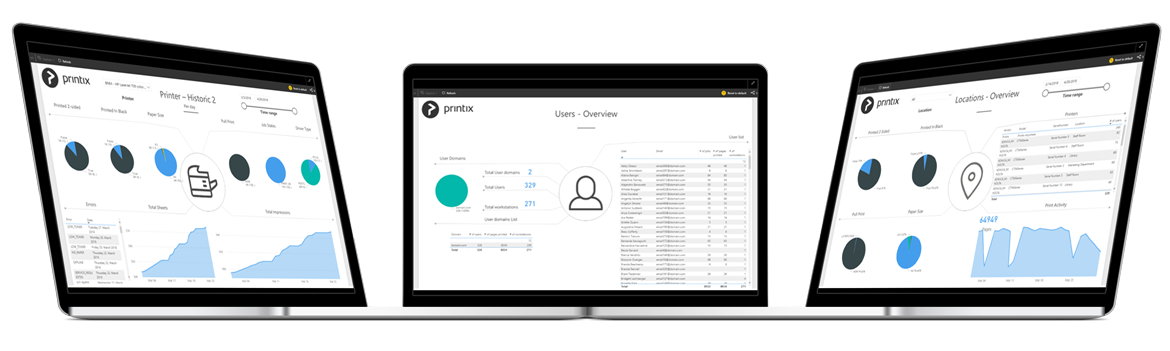
After you have set up analytics, the Printix Power BI report provides a multi-perspective view into your Printix-managed print environment.
Try this interactive Power BI demo report.
The report has the following pages (or tabs):
-
About the report
-
Overview
-
Printers - Overview
-
Printer - History
-
Printers - Service Status
-
Job - History
-
Print Rules - Overview
-
Locations - Overview
-
Users - Overview
-
User - Print Details
-
User - Scan Details
-
User - Copy Details
-
Workstations - Overview
-
Workstations - Details
-
Tree-O-Meter
-
Cost
-
Service Desk
The report uses Coordinated Universal Time (UTC) to display hours. The displayed time may differ from the time zone of your printer.
Popular analysis
How to see who prints the most
- Open page Users - Overview.
How to see print costs
- Set up your own cost the first time you set up the report.
- Familiarize yourself with how the cost calculation is done.
- Open page Cost.
How to see when a user printed
- Open page Job - History.
- Select User.
How to see who printed on a specific printer
- Open page Job - History.
- Select Printer.