How to use the Printix Power BI solution template
The Printix Power BI solution template is designed to give you insights into your print usage, and contains visualizations of data regarding users, workstation, printers, print queues, and much more.
This solution contains multiple key components:
-
A Power BI solution template.
-
A set of PowerPoint design templates and icons, which you can download from here.
The most simple usage of this Power BI template consists of opening it and analyzing your Printix data in Power BI Desktop on your own computer. Furthermore, you can publish it to your organization's online Power BI service to share the report with other users (or even guests), embed visuals into your application, and more.
A demo of a Printix solution template can be viewed here.
Read more about what you can find in the report here.
To start using the Printix Power BI solution:
- Set up Printix analytics.
- Set up Power BI.
-
Optionally,
publish the report to Power BI.
To publish the Power BI report, you need a Power BI Pro license.
When you change the Display Currency parameter, you must manually refresh the whole report. Only selecting Apply in the report is not enough.
How the cost calculation is done
Although it is not possible to accurately calculate the total cost of the printer environment, we can estimate the cost based on what is being printed through Printix.
To allow anyone to define their own cost for different variables, you must provide some input the first time you set up the report:
- Sheets Per Tree
-
Number of sheets created from a single tree
- Cost Per Mono Sheet
-
Cost per page when printed in black and white
- Cost Per Color Sheet
-
Cost per page when printed with colors
- Cost Per Sheet
-
Cost per sheet printed
- Display Currency
-
Currency displayed in all cost-related columns
Based on the actually printed documents (Jobs table), we calculate the cost the following way:
-
Sheet cost
-
This takes into consideration if the document is duplex, and multiples the sum of pages with the cost per sheet.
Code: SWITCH( TRUE (); jobs[duplex] = TRUE(); ROUNDUP(jobs[page_count] / 2;0 ) * sum('Cost Per Sheet'[Cost Per Sheet]); jobs[duplex] = FALSE(); (jobs[page_count] * SUM('Cost Per Sheet'[Cost Per Sheet]) ) + 0)
-
-
Cost per page, printed in black and white
-
If the document is printed in black and white, it multiplies the number of pages with the toner cost (black and white).
Code: SWITCH( TRUE (); jobs[color] = TRUE(); 0 ; jobs[color] = FALSE(); (jobs[page_count] * SUM('Cost Per Mono Sheet'[Cost Per Mono Sheet]) ) + 0)
-
-
Cost per page, printed in color
-
If the document is printed in color, it multiplies the number of pages with the toner cost (color).
Code: SWITCH( TRUE (); jobs[color] = TRUE(); 0 ; jobs[color] = FALSE(); (jobs[page_count] * SUM('Cost Per Mono Sheet'[Cost Per Mono Sheet]) ) + 0)
-
-
Total cost
-
Sums all of the previously mentioned calculations to display the total cost per job.
Code: Total_Cost = jobs[Sheet_Cost] + jobs[Toner_Cost_BW] + jobs[Toner_Cost_Color]
-
All 4 of these calculations have another column with the same name but with (Currency formatted) appended to them. These columns consider the formatting of the selected Display Currency and change the sum to be more user-friendly. These columns are used for all the graphics.
Merging the calculation and the formatting into a single measure can cause severe performance issues with larger data sets, so it should be avoided.
Editing the Power BI template
You can freely alter the Power BI template as needed for your organization.
Changing the Power BI design
The Power BI design is created in PowerPoint and can easily be edited. You can find the design under the PowerPoint folder. The design is mostly built using Storyboards.
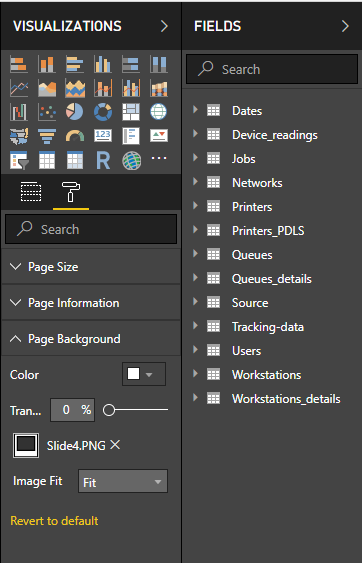
When you alter the design in PowerPoint and export the slides as PNG, you can set them as background images in Power BI. This is done from the Visualizations view. Remember to set the Image Fit setting to Fit. The images from PowerPoint are saved under the Images\PowerPoint directory.
Changing the Power BI theme
The theme for the report is branded with the same style as https://printix.net. You can create your own themes by following Microsoft's official guide.
The included theme is a great start for a customized template and is found under the Themes folder.

